I'm trying to do a deep dive into immunization rates, but I pulled these two up-to-date views into the impact COVID is having on independent pediatric practices.
First, when I post data like the average charge or visit information for our clients across the country, it can tell an accurate story about changes across time for a large group of practices. Sometimes, though, we need to take a slice of that data to see how things are distributed.
That's a long winded way to say, "Here's a view of the distribution of COVID production impact." We know that some practices are much harder hit than others. I grabbed the average charges for January and February and compared them to March...here's what it looks like:

The largest segment of PCC's clients - 16% - were down 41% in March (the "59%" spot on the x-axis). As you can see, there are a number of practices who down as little as 20% or less, but a number of already passed the 50% line. If I have time, we're going to break it down geographically next week.
Next, I wanted to look more at the impact of telemedicine. I've posted some data already, but one thing I wanted to examine is how many practices are actually billing for telemedicine? Here we go:
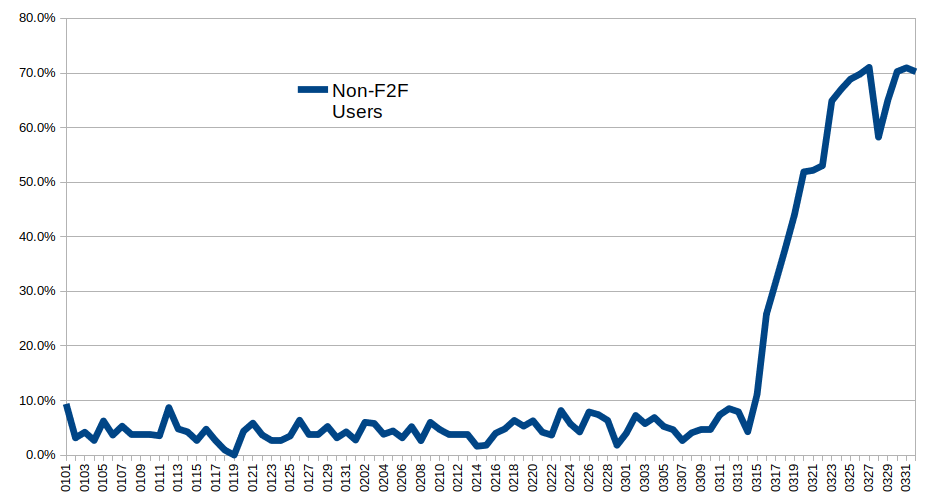
Going back to the beginning of the year, the percentage of PCC practices using at least one telemedicine code every day. You can see that by 03/21 we passed over 50% and are looking at 70% going into last week.
Who are you 30% who still aren't billing for telemedicine?
Comments
0 Comments