If all goes as planned, this will be my last static blog update about the financial clinical data relating to COVID and pediatricians. Why? Because we're hoping to fire up a public page soon that gets updated daily. Stay tuned.
Below, I'm going to essentially cut and paste from the page we're assembling to save myself some time.
Daily Visit and Charge Impact
The core of the pediatric practice business model is seeing patients and charging payers (usually insurance companies) for the visits performed. Thus, the first thing that we investigated was: how are visit and charge volume changing as a result of this pandemic?
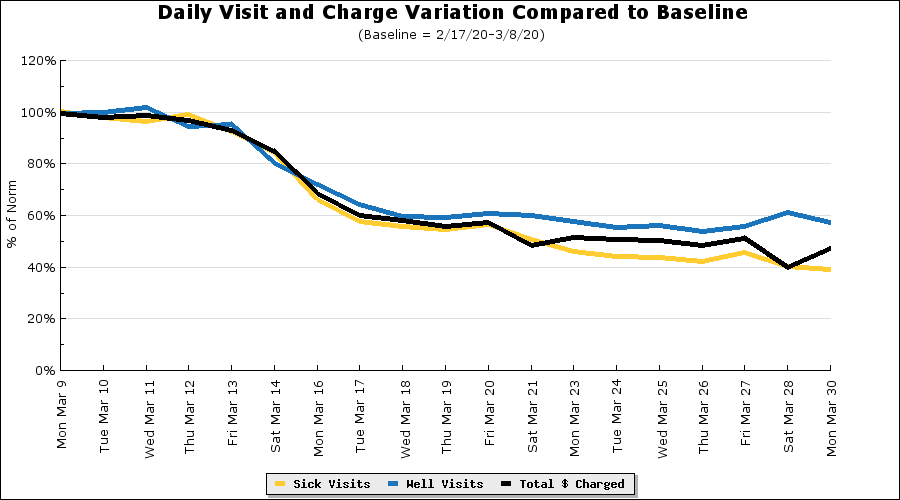
Above, we use the weeks of 2/17 through 3/8 to create a daily baseline standard. Because typical visit volume is not steady throughout a week, we use an average for each Monday, Tuesday, etc., and compare that to the daily performance beginning on 2/9. For example, that means the results for Wednesday, March 18, are compared to the results from Wednesday March 11, March 18, etc.
What we can see is pretty steady and normal visits and charges through the first half of March, with a slow drop off during the second week of March. However, starting on Monday, 3/16, we see a dramatic drop in the volume of well visits, sick visits, and charges generated from visits.
Sick visits have dropped the most and appear to be continuing to do so. As of Thursday, 3/26, they were down to 40% of normal. Well visits and charges are doing similar, though slightly less drastically, with one exception--well visits on Sunday, 3/22, jumped back up. We suspect this is an indication of weekend well visits seeing a lower drop than others. We will keep an eye on this trend as it may indicate that using the weekends to see well visits is a good way to make up for the loss of some mid-week visits.
While charges show the money that is expected in the future, payments show us the money coming in the door now. Payments almost always lag charges (except for the cases where a patient pays at the time of service). When charges decrease, you can expect to see payments decrease in the future. Looking at the patterns we are seeing in daily charges and payments, we can see this play out:
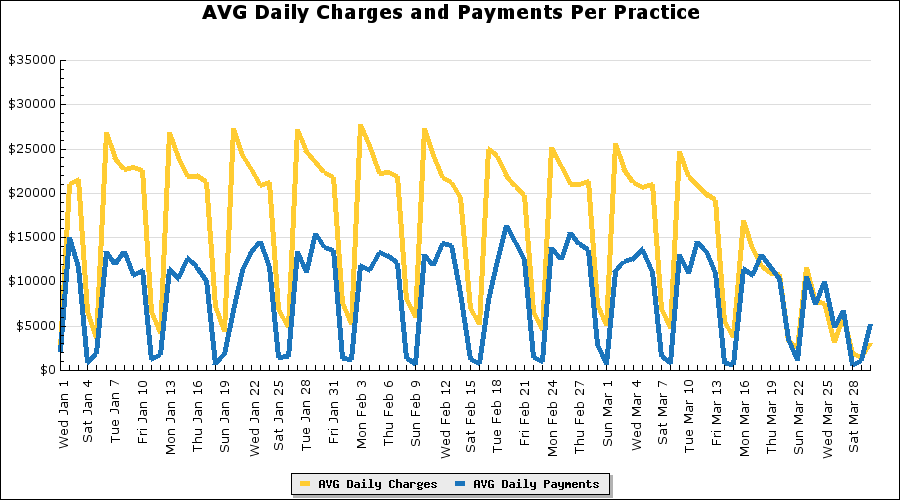
Starting in late February and into early March, daily charges decreased slightly. However, as we saw in the previous chart, charges really drop off starting the week of 3/16.
Payments, however, have held fairly steady throughout, with a small drop in the week of 3/16. That small drop likely represents the decrease in charges that started the week of 2/16 (which we associate with spring break) --one month ago! While we are still analyzing the timing of payments, this gives us an early indication that payments will drop significantly 2-4 weeks after the charges drop.
Take a look at your charges. If they are down significantly in the week of 3/16, start preparing for a big slowdown in revenue somewhere between 3/30 and 4/13. Stay tuned for more insight into this.
The chart below is another way to view the changes in visit volume over the course of this pandemic. However, particularly interesting is the change in the average amount charged for a well visit. It went up!
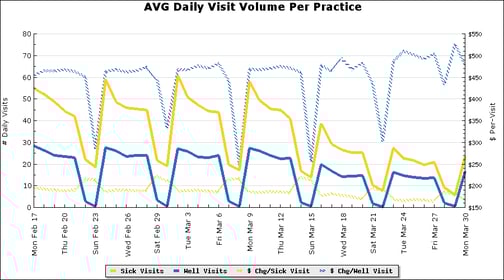
We suspect that the increase in average charge per well visit represents a change in the types of well visits being performed. AAP guidelines and the anecdotal consensus of independent pediatricians posting on SOAPM indicate a focus on providing the well visits that include vaccines. Since vaccines must be purchased, they add cost to these visits and push the overall charge per visit higher.
The Emergence of Telehealth
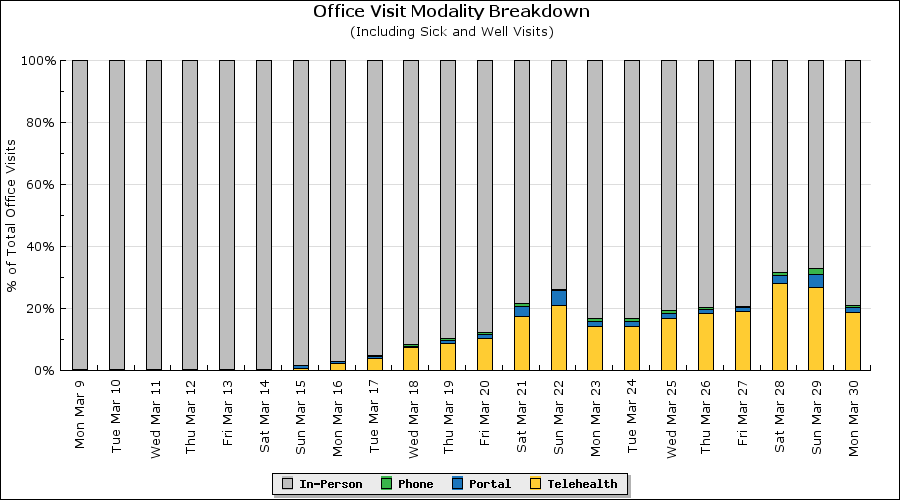
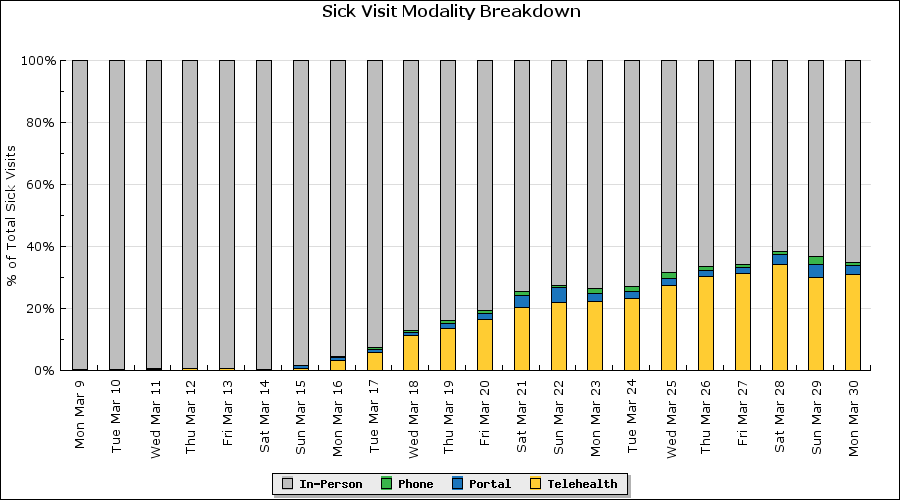
One of the biggest changes that COVID-19 has brought is a rapid adoption of remote visits. We are very early in our collection of data on the use of remote visits, but we can clearly see dramatic adoption of phone, portal, and audio-visual visits starting in mid-March. We expect to see this trend continue and are hard at work digging deeper into the impact of remote visits on the types of visits independent pediatricians are seeing and what the eventual impact on charges, payments, and cash flow will be.
Stay tuned for updates and additional insight to be shared here soon.
Comments
5 Comments