I've heard a lot of dramatic stories about the swing in pediatric visit demand over the last six months. For the third year in a row, our clients have gotten run over by an early-fall rush to their practices followed by a massive dive after the holidays. Our clients in the south provided anecdotal reports early of the viral impact of returning to school this year with the flu/RSV/COVID combination making it impossible for pediatricians feel like they had control of their practices.
Let's see if the volume numbers our clients recorded support the reality. I think they do.
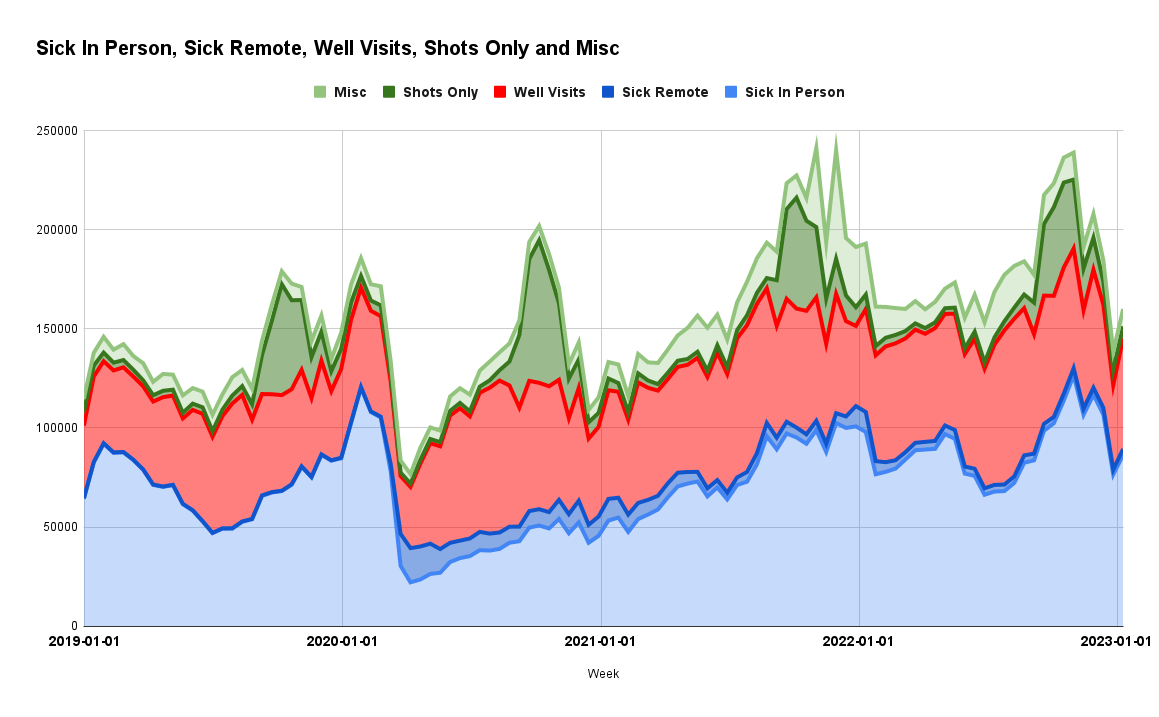
[click on the image for a bigger view]
What you're looking at here is the overall patient volume of PCC practices dating back to 2019. To keep things appropriately relative, we've removed any of our new clients, practices who are no longer with us, etc. This is for the same significant batch of practices over the entire time frame.
Before we dig into what's here, let's review what the data shows us. The two blue lines represent SICK VISIT volume. The larger volume, represented in light blue, represents in person sick visits. The smaller volume - remote sick visits (telemedicine, phone calls, etc.) - is stacked on top of the typical sick visit volume.
The red section represents well visits.
The green section is made up of "shots only" visits (darker green) and "Misc" visits, which are visits with neither a sick nor well code - nor shots - to anchor them. We'll get back to that.
What are some of the takeaways here? There are many.
- Pre-COVID, the 2019/20 flu season was the busiest time we'd ever measured here at PCC. In terms of visit volume, each fall since has dwarfed that time.
- The light-green "Misc" visits are largely made up of 2 things: COVID testing and COVID vaccines (the latter are excluded from the "Shots Only" count). You can see them take off in the spring of 2021 as COVID vaccines were rolled out. There were some enormous spikes in November 2021 and they haven't really slowed since. You are cramming in a lot of extra patients and have been for almost 2 years.
- If you look at just sick and well visits, which are the meat of your business, well visits were the big story, as your capacity to maintain them has been a game saver. However, look at your sick visits - the prolonged peak from Aug through Dec 2021 and the biggest spike ever in Nov/Dec 2022.
Let me put this in perspective. If you had a busy Dec/Jan 2020, before COVID, and were seeing 30 kids a day, you were seeing 42 kids a day in the fall of 2021 and 2022. - There are some subtleties who impact I'm not sure of yet - in 2019 and 2020, the "shots only" visits always peaked during the first 2 weeks of October. In 2021, those visits went through November and in 2022 in started in mid-September and rolled through November. It may not seem like much, but that volume has real weight in your practice.
- The last 3 years has been a ROLLER COASTER. No wonder you are exhausted. Your visit volume drop from Dec 21 -> Jan 22 and in Dec 22 are about as large as the COVID drop back in Mar 2020. Perhaps they are 2 week drops and not single weeks. And a lot of your volume is made from COVID testing, but the impact is still massive.
I don't know if this visual will help, but I grabbed the 2019/20 flu season volume and pasted it over the peaks of the last 2 years...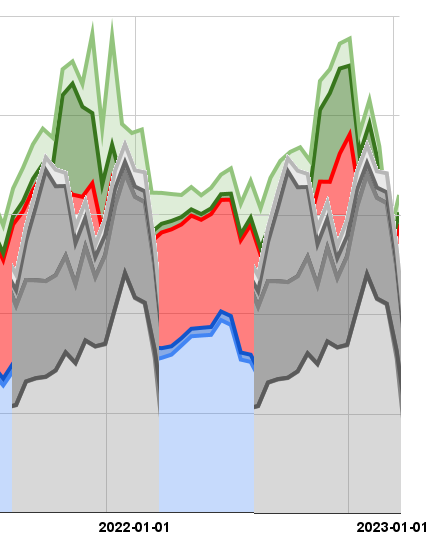
The gray-and-white lines represent the former "busiest time ever" and you'll see that even the calm of the summer in 2022 was almost as busy!
Anyone see any other interesting tidbits?
Comments
6 Comments