Just before COVID hit, we at PCC asked ourselves, "What is a 'full time' pediatrician?"
It's a challenging question to answer for a variety of reasons. "Full time" means very different things in different parts of the country, sometimes simply in different practices. In my world, anything less than 5-days-a-week is some variation of part-time, however in pediatric practice, 4 days of clinical work appears to be an unofficial norm. Sometimes 3.5 or even 3.
Take another perspective - when do third parties (like your EHR vendor and all of their friends) start counting you in their fees? At PCC, we are immediately responsible for a variety of licenses and expenses the moment a clinician sees one patient. We all know vendors who simply count NPIs.
But there's more. A shocking number of you still "hide" clinicians, mostly "mid-level" providers, from the insurance companies using some kind of incident-to billing strategy (often, imo, an ill-informed strategy). This inflates the recorded productivity of doctors, making them look 2-3x busier than they really are.
Ultimately, we weren't able to answer the question. We're still no closer to defining "full time" than when we started. But we got good data out of it :-)
I'll share with you now some of what we learned about how busy you are. There are some interesting stories to read here. First, let me explain the data we're looking at.
- With Alex and Tim's help, I grabbed the visit, dollar, and RVU totals for every "clinician" in the PCC universe for 2022. That includes MDs, DOs, PAs, 5 kinds of NP, PhDs, and plenty of generic doctors ("Flu clinic" or "Southwest Office," etc.).
- I removed everyone who I couldn't identify as a physician. Why? Because in many instances, PAs and NPs get a (bogus) ding to their payments - usually 15% - and I want to keep the comparison clean. It's a lot of work, but it might be worthwhile digging into the average productivity of PAs and NPs. Today, though, just the doctors.
- I drank a big mug of tea and made a subjective decision to eliminate anyone from the data set who didn't see at least ~20 kids a month, or 250 kids a year.
So here we go. Tell me what you think and where you stack up.
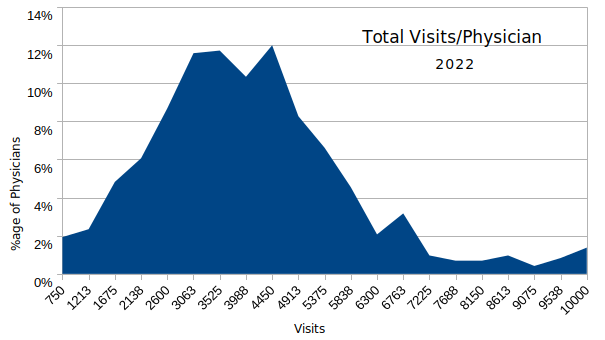
Here is the total visit distribution, by doctor of service, for 2022. It shows that about half of the active pediatricians we know see between 2600 and 4450 visits a year - quite a range, frankly. That computes to a range of ~13-23 kids a day if you work 4 days a week, 48 weeks a year. Note that there's a quite a long tail here...yes, there are pediatricians who see 8,000-14,000 kids a year. I removed any doctors who I knew were including other clinicians in their totals, but I can't confirm that all of the others aren't either.
Average Visits: 3863
Mean Visits: 3666
Here's a breakdown of those visits by sick and well designation:
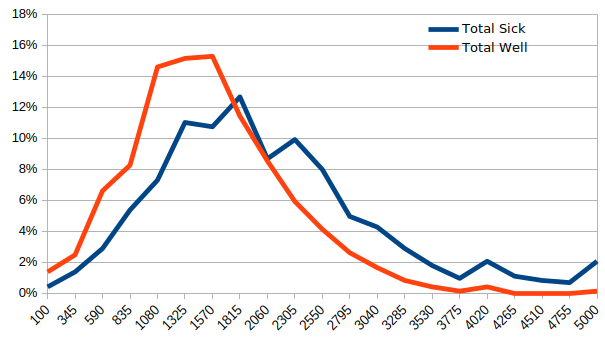 Average Well: 1413
Average Sick: 1961
It's amazing how tightly these distributions have become. 10 years ago, the sick outpaced the well visits significantly. Make sure you don't get mislead by my graph: the higher red line - well visits - doesn't mean there were more well visits than sick visits, just that the well visits are grouped more tightly at a lower number. There is more variability in sick visits, apparently.
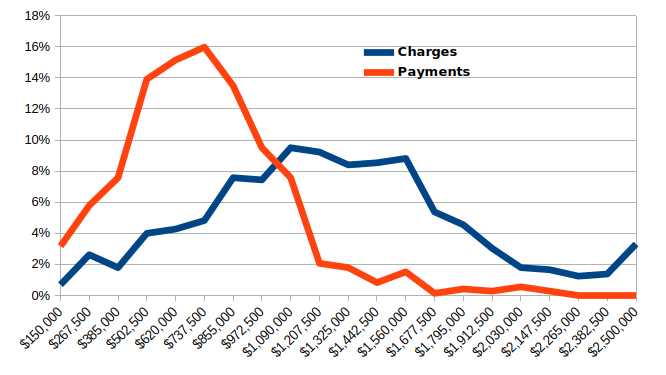 Average Charges: $1.22m
Median Charges: $1.18m
Average Payments: $679K
Median Payments: $646K
Now we're getting to some fun stuff - the money. It's fascinating to see that about 1/2 of you generate between $500 and $855K, though the tail certainly extends. However, the charge distribution isn't nearly as focused in the $1m to $1.6m range as I would expect. Why would I expect that? Because overall, our clients collect ~55% of their charges (a weirdly inelastic number over the last 20 years). What does this mean? I'm not sure, I just find it interesting. OK, last pictures.
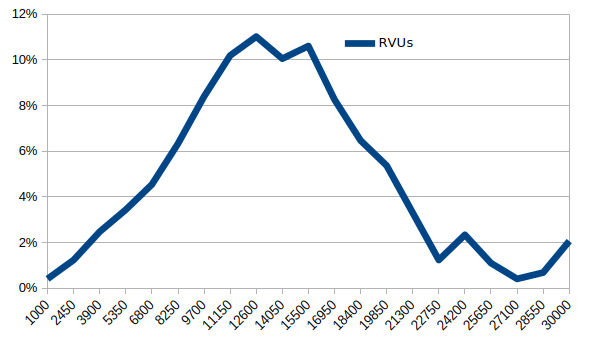
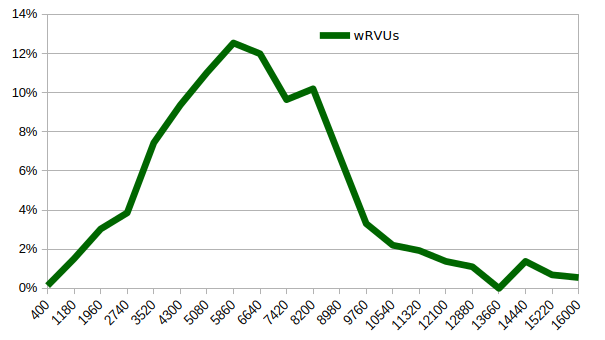
...last, but not least, RVUs and wRVUs.
Average RVUs: 13327
Median RVUs: 12885
Average wRVUs: 6197
Median wRVUs: 5922
The nerds will realize that we can start doing things like figuring out...RVUs per visit or Payments per wRVU now, but I want to hear what others think before I dig into that. I need to have a philosophical discussion about whether to adjust the RVUs geographically when doing certain types of analysis. For example, when comparing actual work accomplished, does it make sense to say that the 10 well visits performed San Jose reflect 50% more physician work than 10 well visits performed in Louisiana? Perhaps when it comes time to pay for things, but I don't think that reflects the volume or quality of work properly. These RVU values are adjusted geographically.
Input welcomed.
Comments
8 Comments