One of my little birdies mentioned discussions on the SOAPM mailing list about new patient benchmarks - what kind of visit volume should be focused on new visits?
Although, on a practice by practice basis, it's difficult to determine what these figures should be, having the benchmarks can help. Here they are:
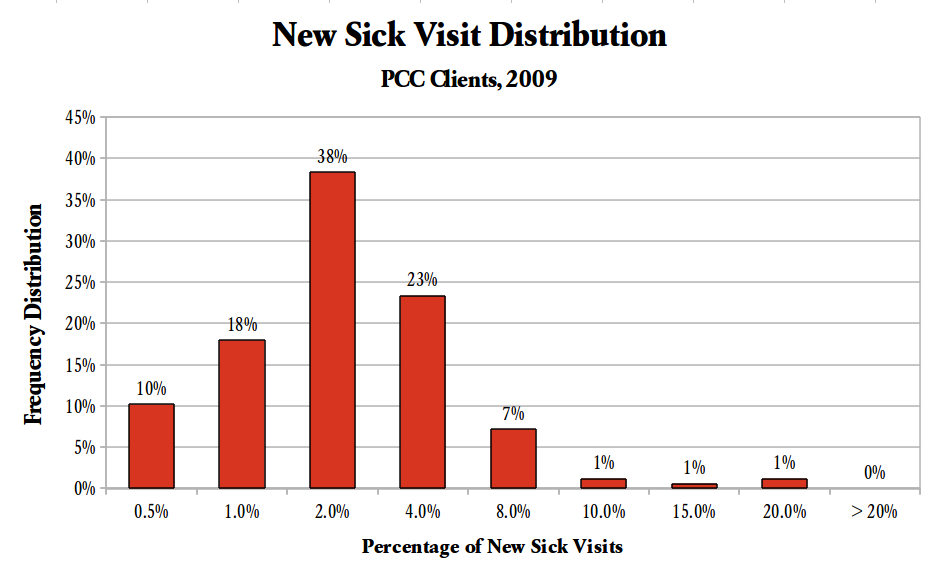
Make sure that you read the graphs correctly. For example, 38% of all PCC clients had between 1-2% of their sick visits recorded as a new one. 23% had between 2-4%. Et cetera.
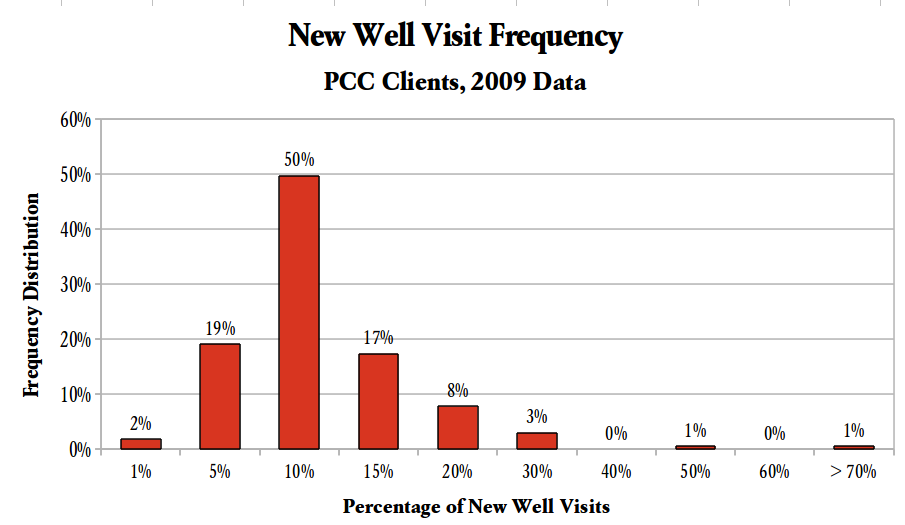
Note: the distributions are not equally divided, as each graph jumps greatly to capture the high-exceptions.
Before I give out details (means, medians, deviations, etc.), someone tell me if this is what SOAPM wanted.
Comments
0 Comments