When we last tuned in, I shared some data about what looks like an explosion of strep diagnoses among our clients. Starting in October of 2022 and running through May (even June), the level of strep out in the wild had reached unprecedented levels. There were some great comments to my post, one of which triggered me to look further into the data, which I did two weeks ago but forgot to share!
It started here: "I would anecdotally suggest that 20% of my 2023 treatments resulted in retreatment within 3 weeks of the end of the last treatment (regardless of antibiotic choice)."
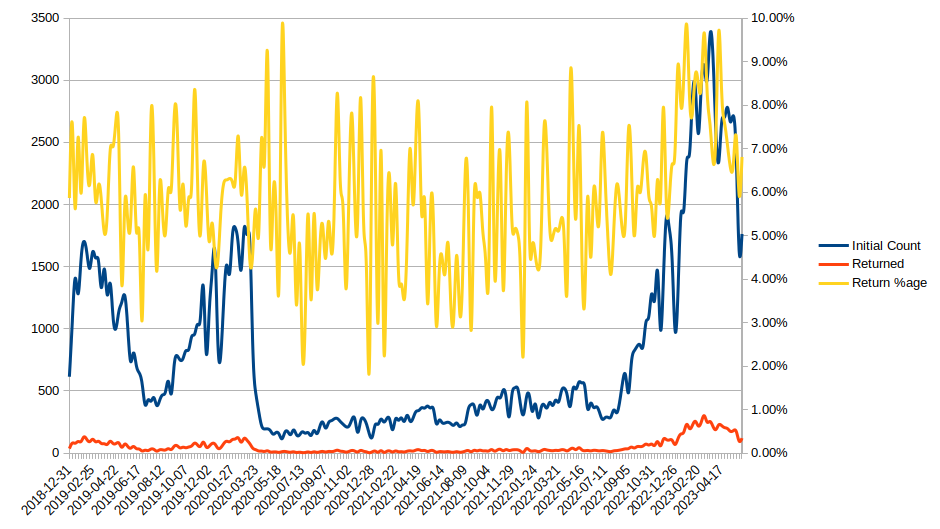
We can't easily measure that, but we can measure the rate at which patients revisit your practices for strep diagnoses. With help from Alex, we looked at everyone who came in with a strep diagnosis and then returned within three weeks for another strep diagnosis. Imperfect, but interesting. Here's what strep rediagnosis looks like:
Let me walk you through this graph.
The blue line, which is anchored to the LEFT Y-axis, shows the raw volume of weekly strep diagnoses. If you follow, there are two peaks on the left side, a huge trough, and then an explosion. Those two peaks represent the 2018/2019 and 2019/2020 seasons. If you go back through time, you'll see that strep wakes up in early winter every year and then holds through sometime in the spring. But then we got none in 20/21 or 21/22. But starting in Oct 22 and peaking in Mar 23, strep came roaring back. We already talked about this.
The red line, also anchored to the left Y-axis, shows the number of those visits that were from patients who'd been previously diagnosed with strep within three weeks of the initial diagnosis. The yellow line, which is anchored to the RIGHT Y-axis, calculates the percentage of overall strep visits that are comprised of these repeats.
I am surprised by how much rediagnosis jumps around, as a swing of 100%+ is common on a biweekly basis...but you can see that the variability seems to increase when the sample gets quite small (April 2020 through July 2022). Nonetheless, there is an increase in rediagnosis during the peak strep run, pushing 7-9% of all cases, but it's not as significant as I expected. What I suspect is that, in addition to the inability to fully measure this clinical issue (see the remarks from the original post), the absolute increase in the cases has a bigger impact than the relative increase.
Questions welcomed!
Comments
3 Comments