We've felt and heard it for over a year now: the demand for mental health services for children has skyrocketed since March, 2020. My clients tell me that they can barely keep up with the demand as anxiety among children has been impossible to manage. It's a national emergency.
Of course, I like to measure these things because how we feel in practice isn't always necessarily reality. With help from the minions, we grabbed all of the ICD10s our clients recorded going back to 2019 (over 42 million data points and 15,000 unique codes) and then organized them by ICD "Section." Can we see an increase in mental health diagnoses? Here's a gross picture that we're not going to dig into, but broadly explain, as I'll give you a highlighted one next.
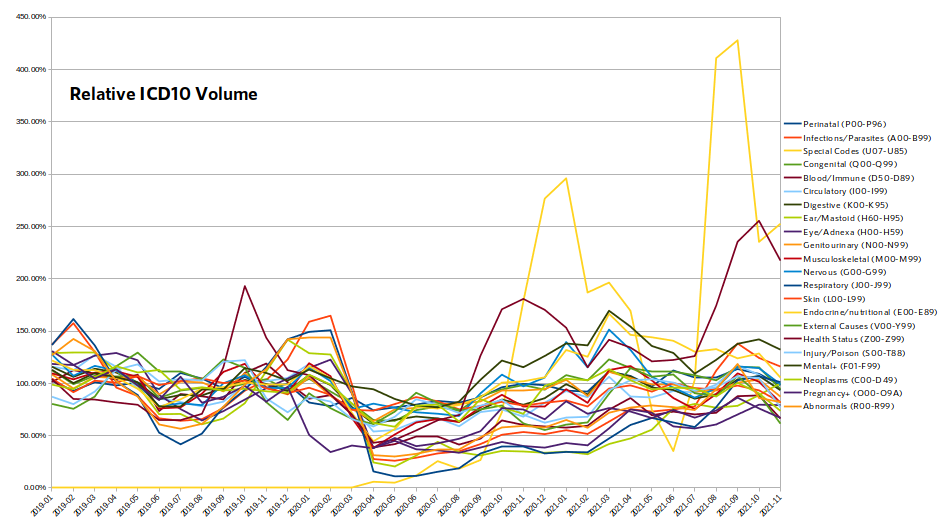
Each of these lines represents a section of ICD10 - simplified to titles like "Respiratory" (J codes) or "Health Status" (Z codes). The Y axis is the volume of each ICD section relative to it's 2019 volume. In other words, if "Certain infectious and parasitic diseases (A00-B99)" are normally 5% of the overall ICD volume then we compared the monthly distribution to that normal - you can see most of the ICDs hover around that 100% from month-to-month for the first year or so of the data. There are some natural ups-and-downs during the year, as you can see that first red line - Health Status (i.e., well visits and immunizations) leap up during September/October/November 2019. Respiratory diagnoses - the dark blue line - has a low in July 2019. No surprises.
Then COVID hits and you can see all kinds of things fall off the table. But it's a little too difficult to follow. So I've stripped out the ICD families that are either extremely low volume or showed the least amount of change post-COVID.
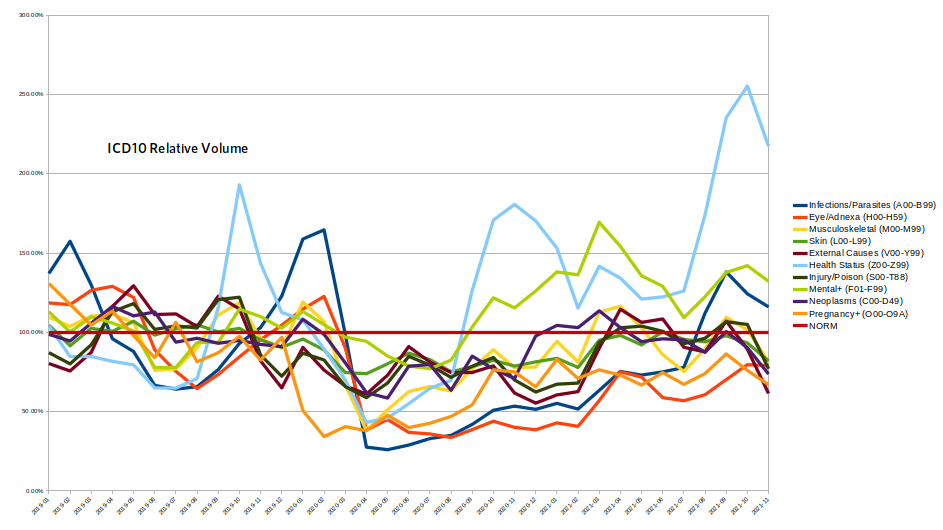
Yes, it's still difficult to follow, especially if you're on a phone, but you can make out the some of the more interesting patterns, now.
Let's begin by noticing the light blue line which has big peaks and valleys - those are Z-codes, which are essentially well visits and immunizations. You should notice them peak in Oct 19, then plummet (along with everything else) in March and April 2020. They come roaring back in September 2020 through January 2021, which is a vaccine/well visit run like we've never seen. It never dips below the 100%/normal line after Aug 20 and then explodes in Sep-Nov 21, thanks to all the extra shots, COVID vaccines, well visit demand, and COVID-related health status diagnoses.
What's next? Check out that dark blue line for Infections+ (A00-B99) and its friends like Eyes (H codes). They dive bomb when COVID hits and don't fully recover until kids start heading back to school in Aug 21.
To get back to the premise, however, take a look at that light green line, which encompasses all of the mental, behavioral, and developmental codes (F00-F99). As you can see, the relative demand for diagnoses starts to hit in Oct 20 and never really calms down. By Mar 21, the reporting of those diagnoses is at 170% of normal. To put this in absolute perspective, and to exaggerate the point, F codes moved from being the 7th most commonly used codes in Jul 20 (5.02% of all volume) to the 5th most in Mar 21 (8.10% of all volume). When you further adjust for the overall difference in visit volumes, many of you are recording one or two more mental health diagnoses per day than usual.
And you can feel it.
I hope this helps to validate those feelings. What to do next is a different question altogether.
Comments
1 Comment