Executive summary: how have the new E&M rules affected E&M distribution in our world? Not much, but it's interesting.
[Click on the image for closer detail.]
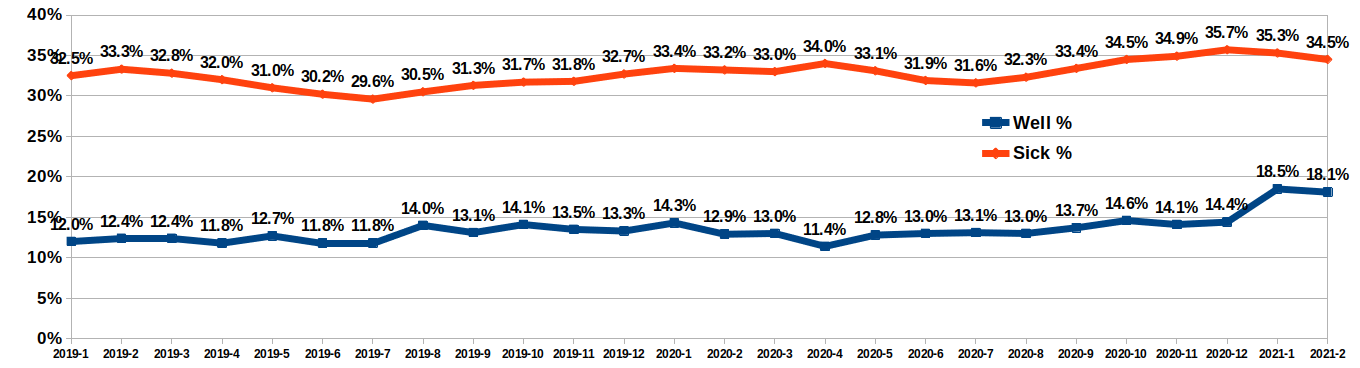
The graph above shows the change in E&M distribution for PCC clients dating back to 2019 and through February 2021. Here's what you need to know:
- The single digit measure here is the "volume of 99214s and 99215s relative to the total 99212-99215s." February 2021 reports a 34.5% rate of 99214s and 99215s among sick visit E&Ms. It's the only way I've come up with to simply and easily compare E&M distributions between time frames. Perfect? No. But pretty good.
- We've broken the analysis into "sick visits" and "well visits with sick E&Ms." You know, -25 modified codes. Often, when you see E&M benchmarks, practices just blend all their 9921Xs together, and that's not an accurate view of the practice. You can see the distinction above with the red and blue lines (more on that below).
My conclusions, draw your own and share them in the comments:
- There is a cycle to E&M complexity - it's lower in the summer and higher in the winter. That cycle goes back as far as I've ever measured.
- There's also a slow, steady increase to E&M coding complexity. In 2003, the value was ~13%.
- Yes, there is a small drop in E&M complexity starting Jan 2021, but it's hard to distinguish that change from the natural ebb and flow. Note that December 2020 was the all-time high.
- Even with the small drop, the recorded E&M complexity in January and February were higher than any point in our data history except the previous two months, November and December.
- Look at what happened to well visit sick codes! An enormous change, frankly. And we knew this was coming - it's a lot easier to justify a sick visit now.
- That blip in April 2020 is interesting from a clinical perspective.
I've still heard plenty of stories of practices who feel like their E&M distributions have plummeted. A quick analysis of PCC's clients compared Feb 2020 E&M distribution to Feb 2021 distribution and the ratio of practices whose distribution increased to those who decreased was a little more than 2:1. If folks really think this is a problem, I can dig into what types of practices are dropping the most, but I suspect it's limited to practices with high E&M distribution.
Input welcomed.
Comments
3 Comments