This roller coaster has been a rough ride. The two biggest pediatric droughts in history - March/April 2020 and January/February 2021 - up against the busiest times in pediatric history - January/February 2020 and now August/September 2021.
That's right. I'm not sure everyone has had the space to really put the recent visit volume into context especially when the emotional drain of having to fight (families, staff, insurance companies) is so profound right now. I want to share a little data with everyone to help show you why you're exhausted - I feel like knowing and seeing just might help you feel a tiny bit better. So I set off to look into how busy you really are and what I found was interesting.
In a week or two, I'll have data right up through September to put it into absolute terms, but try this on for size:
[click on it to zoom in, of course]
Let me explain what I did here and what this means.
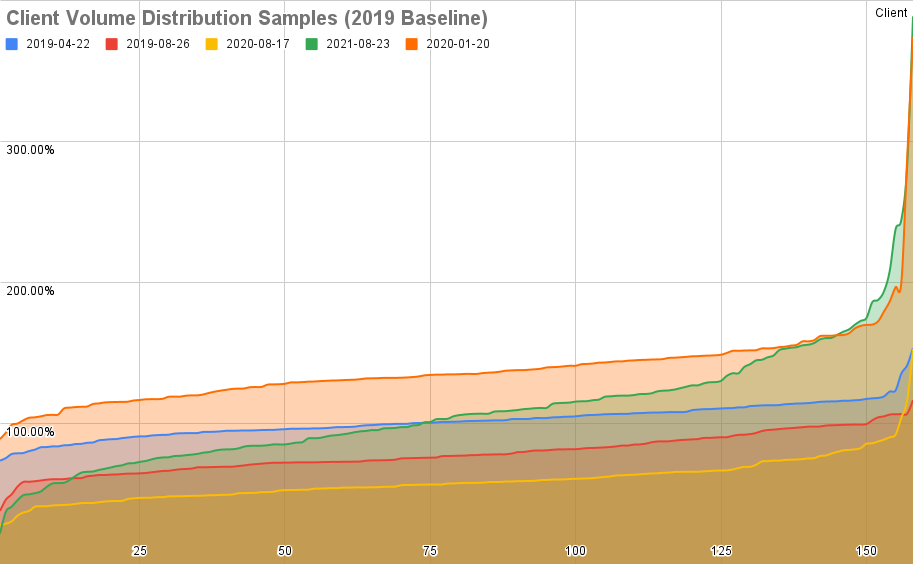
First, I isolated our client base to only those practices who were fully operational and relatively stable from Jan 2019 to now. That means no startups, no practices who closed or joined a hospital (boo!), no new-to-PCC practices, etc. I didn't want expected variations in patient volume to contribute to this review. The practices are indicated by the X-axis. There were about 160 practices isolated here, so the "75" line in middle makes a good mid-point.
Second, I then looked at each practice's average visit volume for the entire year of 2019. Practice A might be 18 kids a day, Practice B might be 250 - depends on the size and nature of the practice, but I wanted each practice to be its own baseline. The relative volume is indicated by the Y-axis.
I then plotted the individually comparative visit volume of selected 2-week segments over the last 2+ years for each of the practices - and what it shows will underscore what many of you have experienced lately, though it also raises many questions!
Take a look at the blue line first. There, I sampled the visit volume of each practice for the two weeks starting 04-22-19 and compared it to each of their average 2019 visit volumes. You'll notice that the blue line is relatively flat. Most of the practices are within a few percentage points of normal 2019 volume in April. In fact, you can see that about half the practices are slightly below average and half slightly above - see where the blue line crosses the 100% line? Yes, at both ends of the distribution you will see some practices at perhaps 80% of usual volume or at 150% of volume.
But look at how atypical the other weeks are. Let's review.
Start with the two weeks in August, 2019 (the red line). It's peak well visit season. So, visit volume is down because you're packed in with well visits. You can see that all but one or two practices is actually "below average" for that week - which makes sense when comparing peak well visit time to the rest of the year. Also note that the line is relatively flat..in August, 2019, you were all in similar places.
Let's contrast that with the orange line, which is January 2020, arguably the busiest time in pediatric history to that point. You'll notice that all but a small handful of practices are well above the 2019 average visit volume. Most practices are above 150% normal volume and, at the far end, some are off the map! Again, this isn't a surprise - January 2020 was a busy flu season and there was massive demand for pediatric services (from Oct 2019 through Feb 2020, in fact).
However, let's now look at August 2020 and 2021. I matched up mid/late August 2020 to 2019 volume with the yellow line. It should be no surprise that volume was down everywhere. All but a few practices had fewer visits in August 2020 than ever before in an August. COVID kept well visits down and sick visits were at the lowest rate I've ever seen.
Here's the kicker. Check out the green line. It's relative visit volume for late August 2021. And...whoa. For many practices, the volume was not only significantly higher than average, it was 2x the volume from the same time in 2020. And look at that far right end - some practices were (and are!) getting slammed!
In other words, August 2021 was as busy for some practices as January 2020, the previously most busy month in history. One big difference, though: a lot of those visits in August were well visits. You had sick season demand in August. That's what zapped you.
Note, though, that there's another subtle takeaway here. About half of the practices were still below average 2019 volume. Some quite a bit so. I dug into that for a bit and learned a couple things:
-
- The August 2021 tidal wave definitely hit different practices, perhaps regionally, at slightly different times. I expect that if I hand picked the comparative weeks on a practice level basis, some of those below-average volume practices would slide up. I think the southern states, whose schools opened earlier, got hit first.
- However, it's clear that quite a few practices have never returned to 2019 visit volume. That's right. My view of the world has been colored by all the practices on fire and we're not hearing from the silent near-majority of practices who are not being overrun.
Comments? Thoughts?
Comments
2 Comments