UPDATE, 01/28/21: When I completed this analysis in December, 2020, I was using the originally published GPCI values. In early January, the Feds updated the GPCI values significantly. It took me a little bit to get back to this, but I've updated the results. Executive summary: the change benefited nearly half of the GPCI locations and harmed none of them. A welcome improvement.
Every year, I do an analysis of the RBRVS GPCI values - I think this is the most overlooked aspect of the RVU changes from year to year.
What are the GPCI values? They are the Geographic Practice Cost Indices used by the Feds and private payors to adjust the payments or valuation of CPT codes based on where you work - Long Island is a more expensive locale in which to practice than Alabama, apparently, and insurance payments reflect that fact.
Here are reports from 2020, 2019, 2018, 2017, 2014, 2012 if you want to have some fun. As you will see, some localities have had massive swings in RVU value over the last decade. Hence, my work.
Methodology
I started by looking at the procedures that make up 99% of all ambulatory pediatric revenue and have RVU values - it's about 150 or so. I then look at their relative volume and determine two things: first, I can see what the expected impact will be on RVUs for all pediatricians (that's coming shortly); second, I can determine a rough "weighting" of the Work/PE/MP expenses for pediatricians in order to estimate the impact of the GPCI scores. In my calculations, in 2019 the Work expense makes up ~46% of pediatric RVU values, Practice Expense is ~50.5%, and Malpractice ~3.5% - of course, this varies by practice, but not much in my experience. I can then apply those weights to the GPCI scores and get the results below.
PLEASE NOTE: These results reflect the 2019 GPCI weighting and have not taken into account a) the impact of COVID and b) the new 2021 E&M values. Those factors will be an issue, but do we know how the massive drop in sick visits will really play out? I can model some things, but not for today.
Keep in mind whatever changes get made to the individual CPT codes in 2021, or to the Medicare multiplier, etc., these values are on top of all that. If you're in Arkansas your RVUs will drop by 3.26% in 2021 whether you like it or not. Metro Boston? You're up 2.5%. Etc.
Further, I used the same weighted data to judge the overall GPCI weighting. If you live in Tennessee, your GPCI will generally deliver RVUs (and, therefore, $$) that is 91.45% of the "national" value. If you live in Washington, DC or the suburbs, you'll get 115% of flat Medicare. Again, based on normal pediatric CPT distribution.
Dig in, look up your state. How do you fare? Do your relative RVUs go up or down?
Here's the table and then two COOL GRAPHS.
| Locality | 2017-2021 Weighted Difference |
Estimated Relative Value |
| ALABAMA | 1.43% | 94.09% |
| ALASKA | -0.03% | 127.61% |
| ARIZONA | -1.78% | 97.02% |
| ARKANSAS | -1.61% | 90.39% |
| CA, BAKERSFIELD | 0.14% | 103.82% |
| CA, CHICO | -0.59% | 103.06% |
| CA, EL CENTRO | -0.52% | 103.13% |
| CA, FRESNO | -0.59% | 103.06% |
| CA, HANFORD-CORCORAN | -0.59% | 103.06% |
| CA, LOS ANGELES-LONG BEACH-ANAHEIM (LOS ANGELES CNTY) | 0.17% | 110.14% |
| CA, LOS ANGELES-LONG BEACH-ANAHEIM (ORANGE CNTY) | -0.85% | 110.14% |
| CA, MADERA | -0.59% | 103.06% |
| CA, MERCED | -0.59% | 103.06% |
| CA, MODESTO | -0.59% | 103.06% |
| CA, NAPA | -2.68% | 111.31% |
| CA, OXNARD-THOUSAND OAKS-VENTURA | -0.05% | 109.26% |
| CA, REDDING | -0.59% | 103.06% |
| CA, REST OF CALIFORNIA | -0.59% | 103.06% |
| CA, RIVERSIDE-SAN BERNARDINO-ONTARIO | 0.39% | 104.14% |
| CA, SACRAMENTO-ROSEVILLE-FOLSOM | 0.44% | 104.18% |
| CA, SALINAS | 3.35% | 107.36% |
| CA, SAN DIEGO-CHULA VISTA-CARLSBAD | 3.26% | 107.52% |
| CA, SAN FRANCISCO-OAKLAND-BERKELEY (ALAMEDA/CONTRA COSTA CNTY) | 1.98% | 118.14% |
| CA, SAN FRANCISCO-OAKLAND-BERKELEY (MARIN CNTY) | 2.37% | 117.13% |
| CA, SAN FRANCISCO-OAKLAND-BERKELEY (SAN FRANCISCO CNTY) | -1.12% | 118.14% |
| CA, SAN FRANCISCO-OAKLAND-BERKELEY (SAN MATEO CNTY) | -0.73% | 118.14% |
| CA, SAN JOSE-SUNNYVALE-SANTA CLARA (SAN BENITO CNTY) | 12.16% | 119.01% |
| CA, SAN JOSE-SUNNYVALE-SANTA CLARA (SANTA CLARA CNTY) | 1.77% | 121.57% |
| CA, SAN LUIS OBISPO-PASO ROBLES | 0.38% | 104.07% |
| CA, SANTA CRUZ-WATSONVILLE | 4.49% | 109.59% |
| CA, SANTA MARIA-SANTA BARBARA | 3.76% | 108.20% |
| CA, SANTA ROSA-PETALUMA | 3.93% | 108.48% |
| CA, STOCKTON | -0.59% | 103.06% |
| CA, VALLEJO | -2.68% | 111.31% |
| CA, VISALIA | -0.59% | 103.06% |
| CA, YUBA CITY | -0.59% | 103.06% |
| COLORADO | 0.57% | 101.57% |
| CONNECTICUT | -0.57% | 107.20% |
| DC + MD/VA SUBURBS | 1.69% | 115.41% |
| DELAWARE | -0.99% | 101.07% |
| FL, FORT LAUDERDALE | -0.61% | 103.14% |
| FL, MIAMI | -0.04% | 107.01% |
| FL, REST OF FLORIDA | -0.51% | 98.50% |
| GA, ATLANTA | -0.55% | 99.55% |
| GA, REST OF GEORGIA | -1.43% | 93.52% |
| HAWAII, GUAM | 0.03% | 106.48% |
| IDAHO | -1.60% | 91.72% |
| IL, CHICAGO | -0.01% | 105.85% |
| IL, EAST ST. LOUIS | -0.27% | 99.46% |
| IL, REST OF ILLINOIS | -0.29% | 96.23% |
| IL, SUBURBAN CHICAGO | -0.22% | 105.21% |
| INDIANA | -1.19% | 93.05% |
| IOWA | 0.14% | 93.26% |
| KANSAS | -0.64% | 93.43% |
| KENTUCKY | -0.30% | 92.79% |
| LA, NEW ORLEANS | -1.71% | 98.23% |
| LA, REST OF LOUISIANA | -0.40% | 94.67% |
| MA, METROPOLITAN BOSTON | 2.50% | 111.90% |
| MA, REST OF MASSACHUSETTS | 0.03% | 103.70% |
| MD, BALTIMORE/SURR. CNTYS | 0.47% | 107.24% |
| MD, REST OF MARYLAND | 0.20% | 102.62% |
| ME, REST OF MAINE | -1.18% | 93.62% |
| ME, SOUTHERN MAINE | -0.52% | 98.60% |
| MI, DETROIT | 0.64% | 102.09% |
| MI, REST OF MICHIGAN | -0.50% | 95.45% |
| MINNESOTA | -0.11% | 98.33% |
| MISSISSIPPI | -0.67% | 90.87% |
| MO, METROPOLITAN KANSAS CITY | -0.74% | 97.34% |
| MO, METROPOLITAN ST. LOUIS | 0.42% | 98.39% |
| MO, REST OF MISSOURI | -0.77% | 91.94% |
| MONTANA | -1.60% | 99.92% |
| NEBRASKA | -0.46% | 92.62% |
| NEVADA | -0.20% | 101.49% |
| NEW HAMPSHIRE | -0.84% | 101.61% |
| NEW MEXICO | -1.39% | 95.37% |
| NJ, NORTHERN NJ | 0.97% | 112.12% |
| NJ, REST OF NEW JERSEY | 1.13% | 108.65% |
| NORTH CAROLINA | 0.17% | 95.73% |
| NORTH DAKOTA | -0.42% | 97.95% |
| NY, MANHATTAN | 2.52% | 116.50% |
| NY, NYC SUBURBS/LONG ISLAND | 2.37% | 119.45% |
| NY, POUGHKPSIE/N NYC SUBURBS | 3.02% | 108.85% |
| NY, QUEENS | 2.94% | 120.02% |
| NY, REST OF NEW YORK | 0.64% | 96.85% |
| OHIO | 0.09% | 95.96% |
| OKLAHOMA | -0.51% | 93.23% |
| OR, PORTLAND | 0.43% | 102.51% |
| OR, REST OF OREGON | -1.81% | 95.66% |
| PA, METROPOLITAN PHILADELPHIA | -0.32% | 105.90% |
| PA, REST OF PENNSYLVANIA | -0.14% | 96.53% |
| PUERTO RICO | 9.71% | 100.35% |
| RHODE ISLAND | -0.02% | 103.31% |
| SOUTH CAROLINA | -0.25% | 94.03% |
| SOUTH DAKOTA | -0.18% | 97.65% |
| TENNESSEE | -0.56% | 92.74% |
| TX, AUSTIN | 1.17% | 101.31% |
| TX, BEAUMONT | 0.33% | 95.57% |
| TX, BRAZORIA | 0.76% | 101.01% |
| TX, DALLAS | 0.27% | 100.74% |
| TX, FORT WORTH | -0.13% | 98.83% |
| TX, GALVESTON | 0.01% | 101.17% |
| TX, HOUSTON | 1.38% | 102.57% |
| TX, REST OF TEXAS | 0.52% | 96.24% |
| UTAH | -1.68% | 95.21% |
| VERMONT | -0.71% | 98.50% |
| VIRGIN ISLANDS | 0.08% | 100.35% |
| VIRGINIA | 0.62% | 99.38% |
| WA SEATTLE (KING CNTY) | 2.64% | 110.61% |
| WA, REST OF WASHINGTON | 0.25% | 99.78% |
| WEST VIRGINIA | 0.24% | 93.57% |
| WISCONSIN | -1.34% | 94.55% |
| WYOMING | -0.75% | 99.43% |
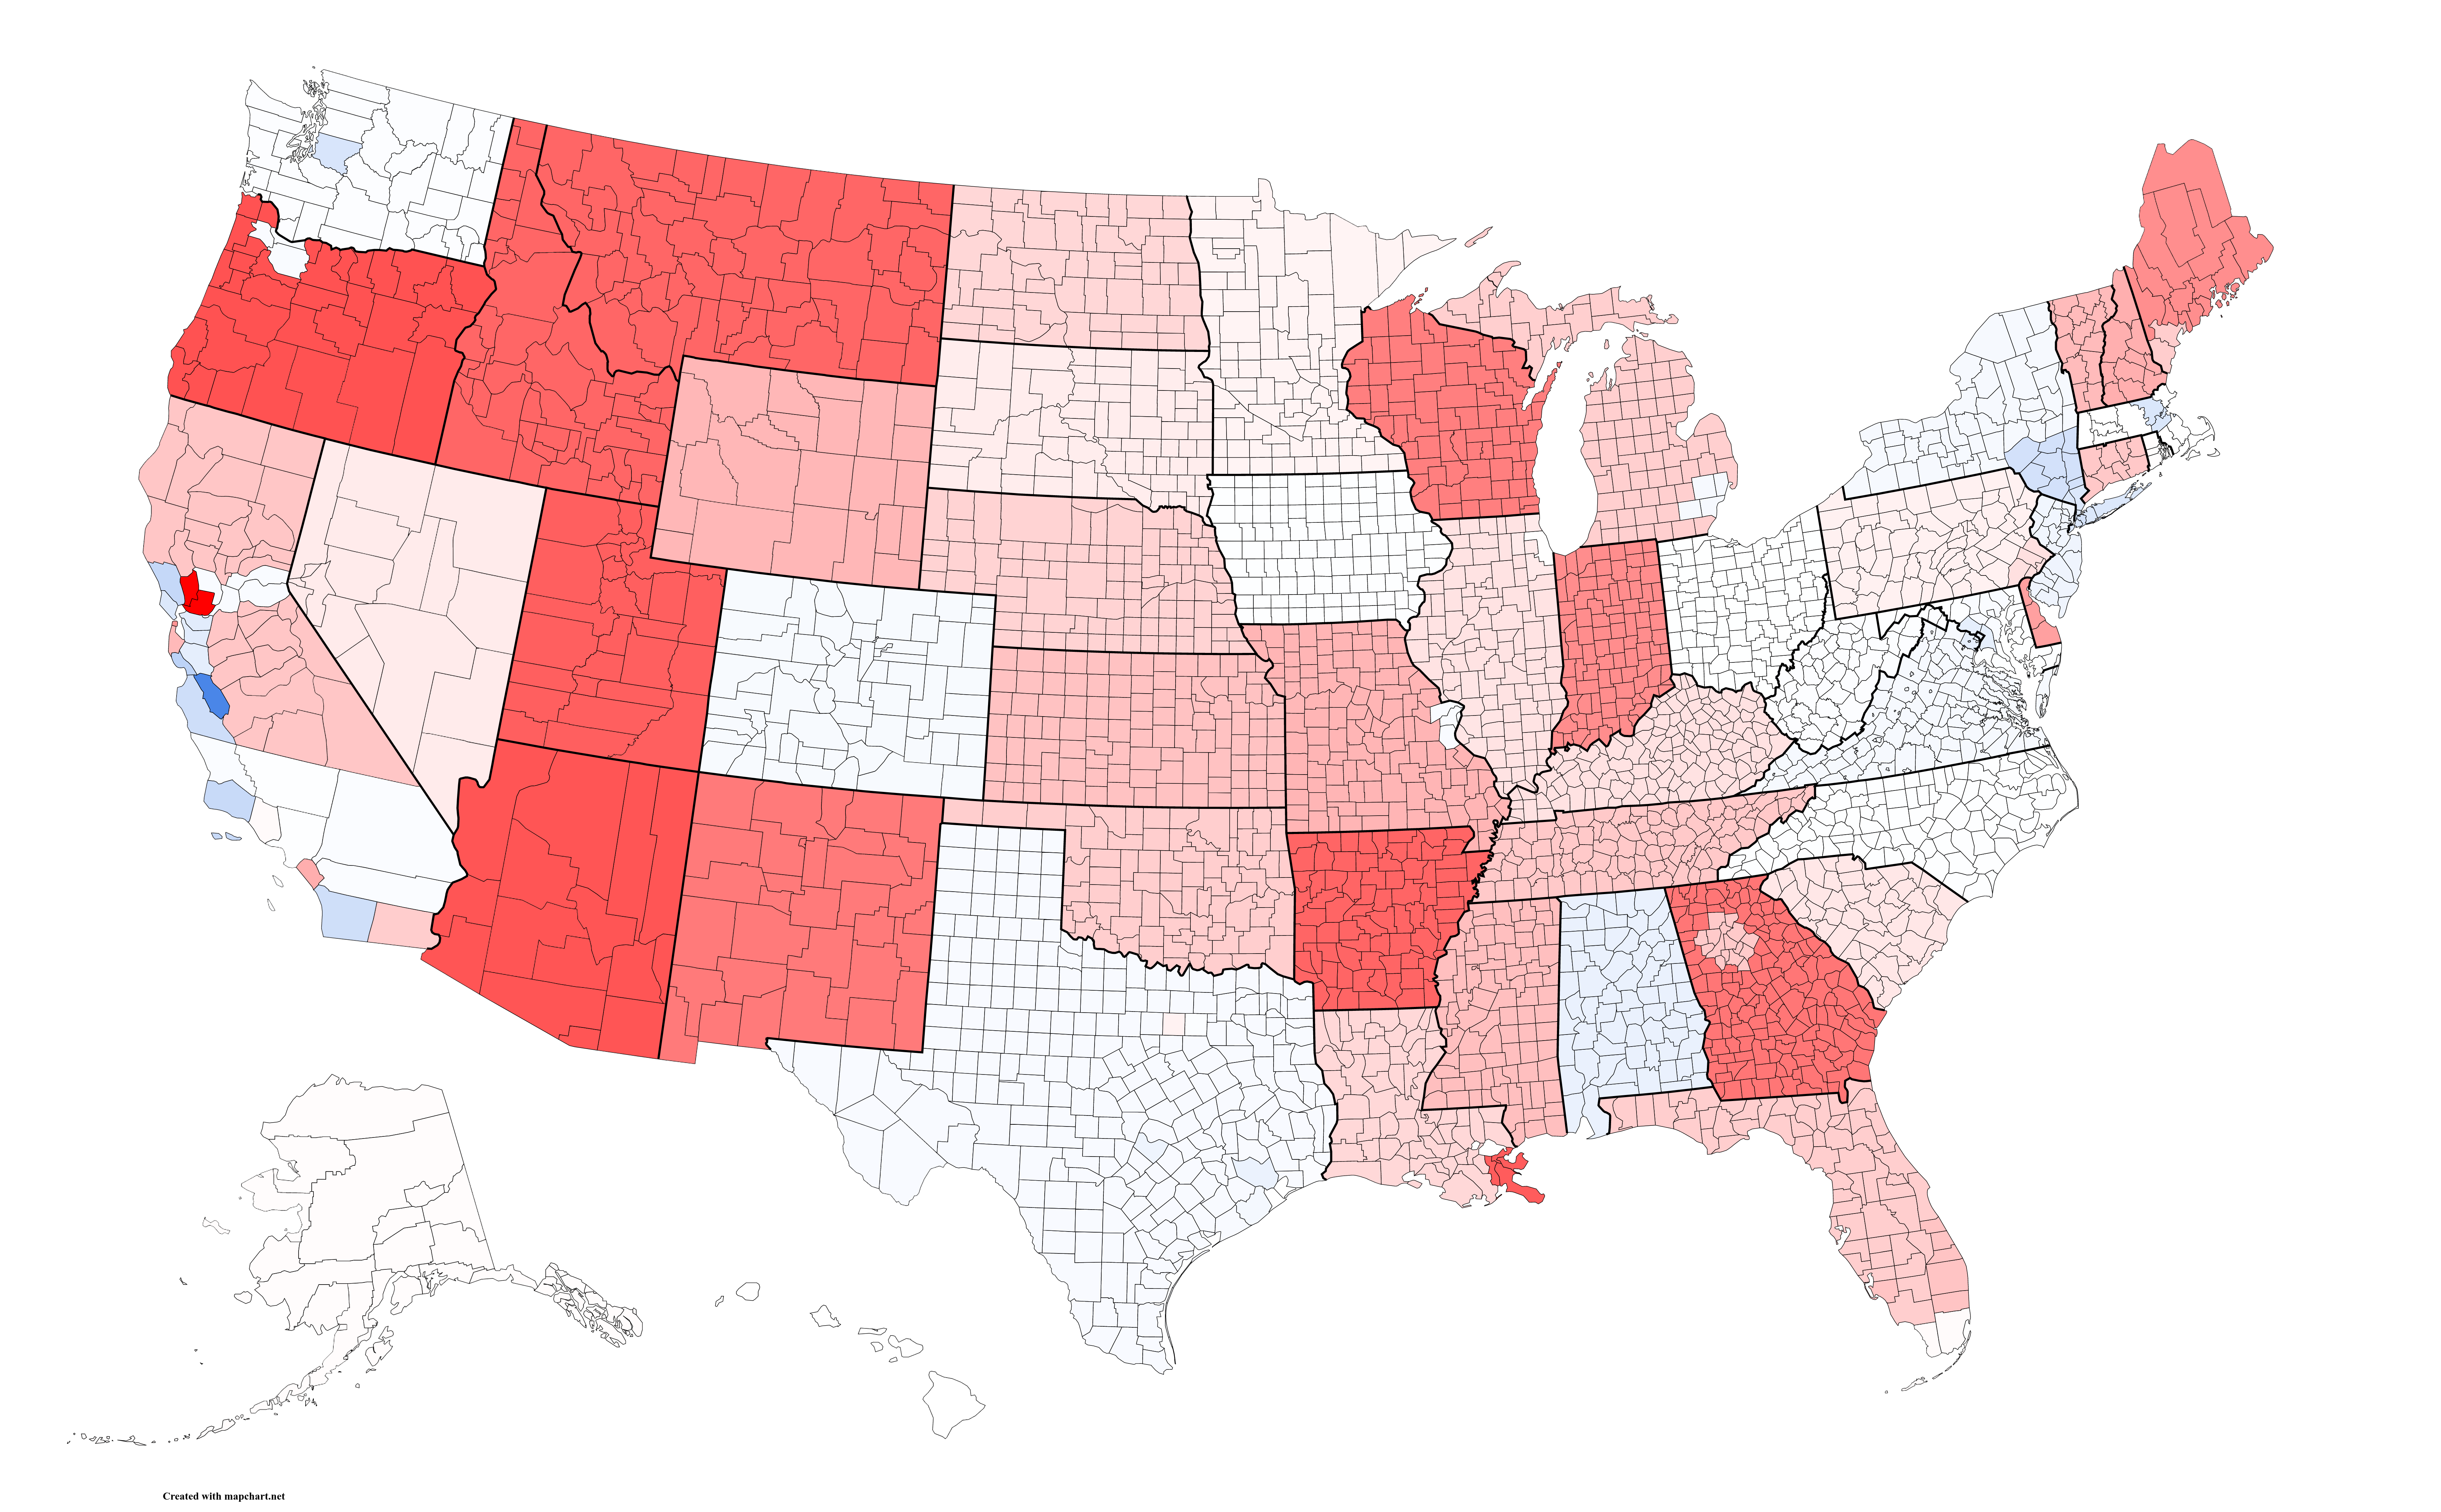
Next, a visual of the United States, county by county, show the change in GPCI valuation since 2017. The deeper the red, the bigger the drop - the data is in the table above.
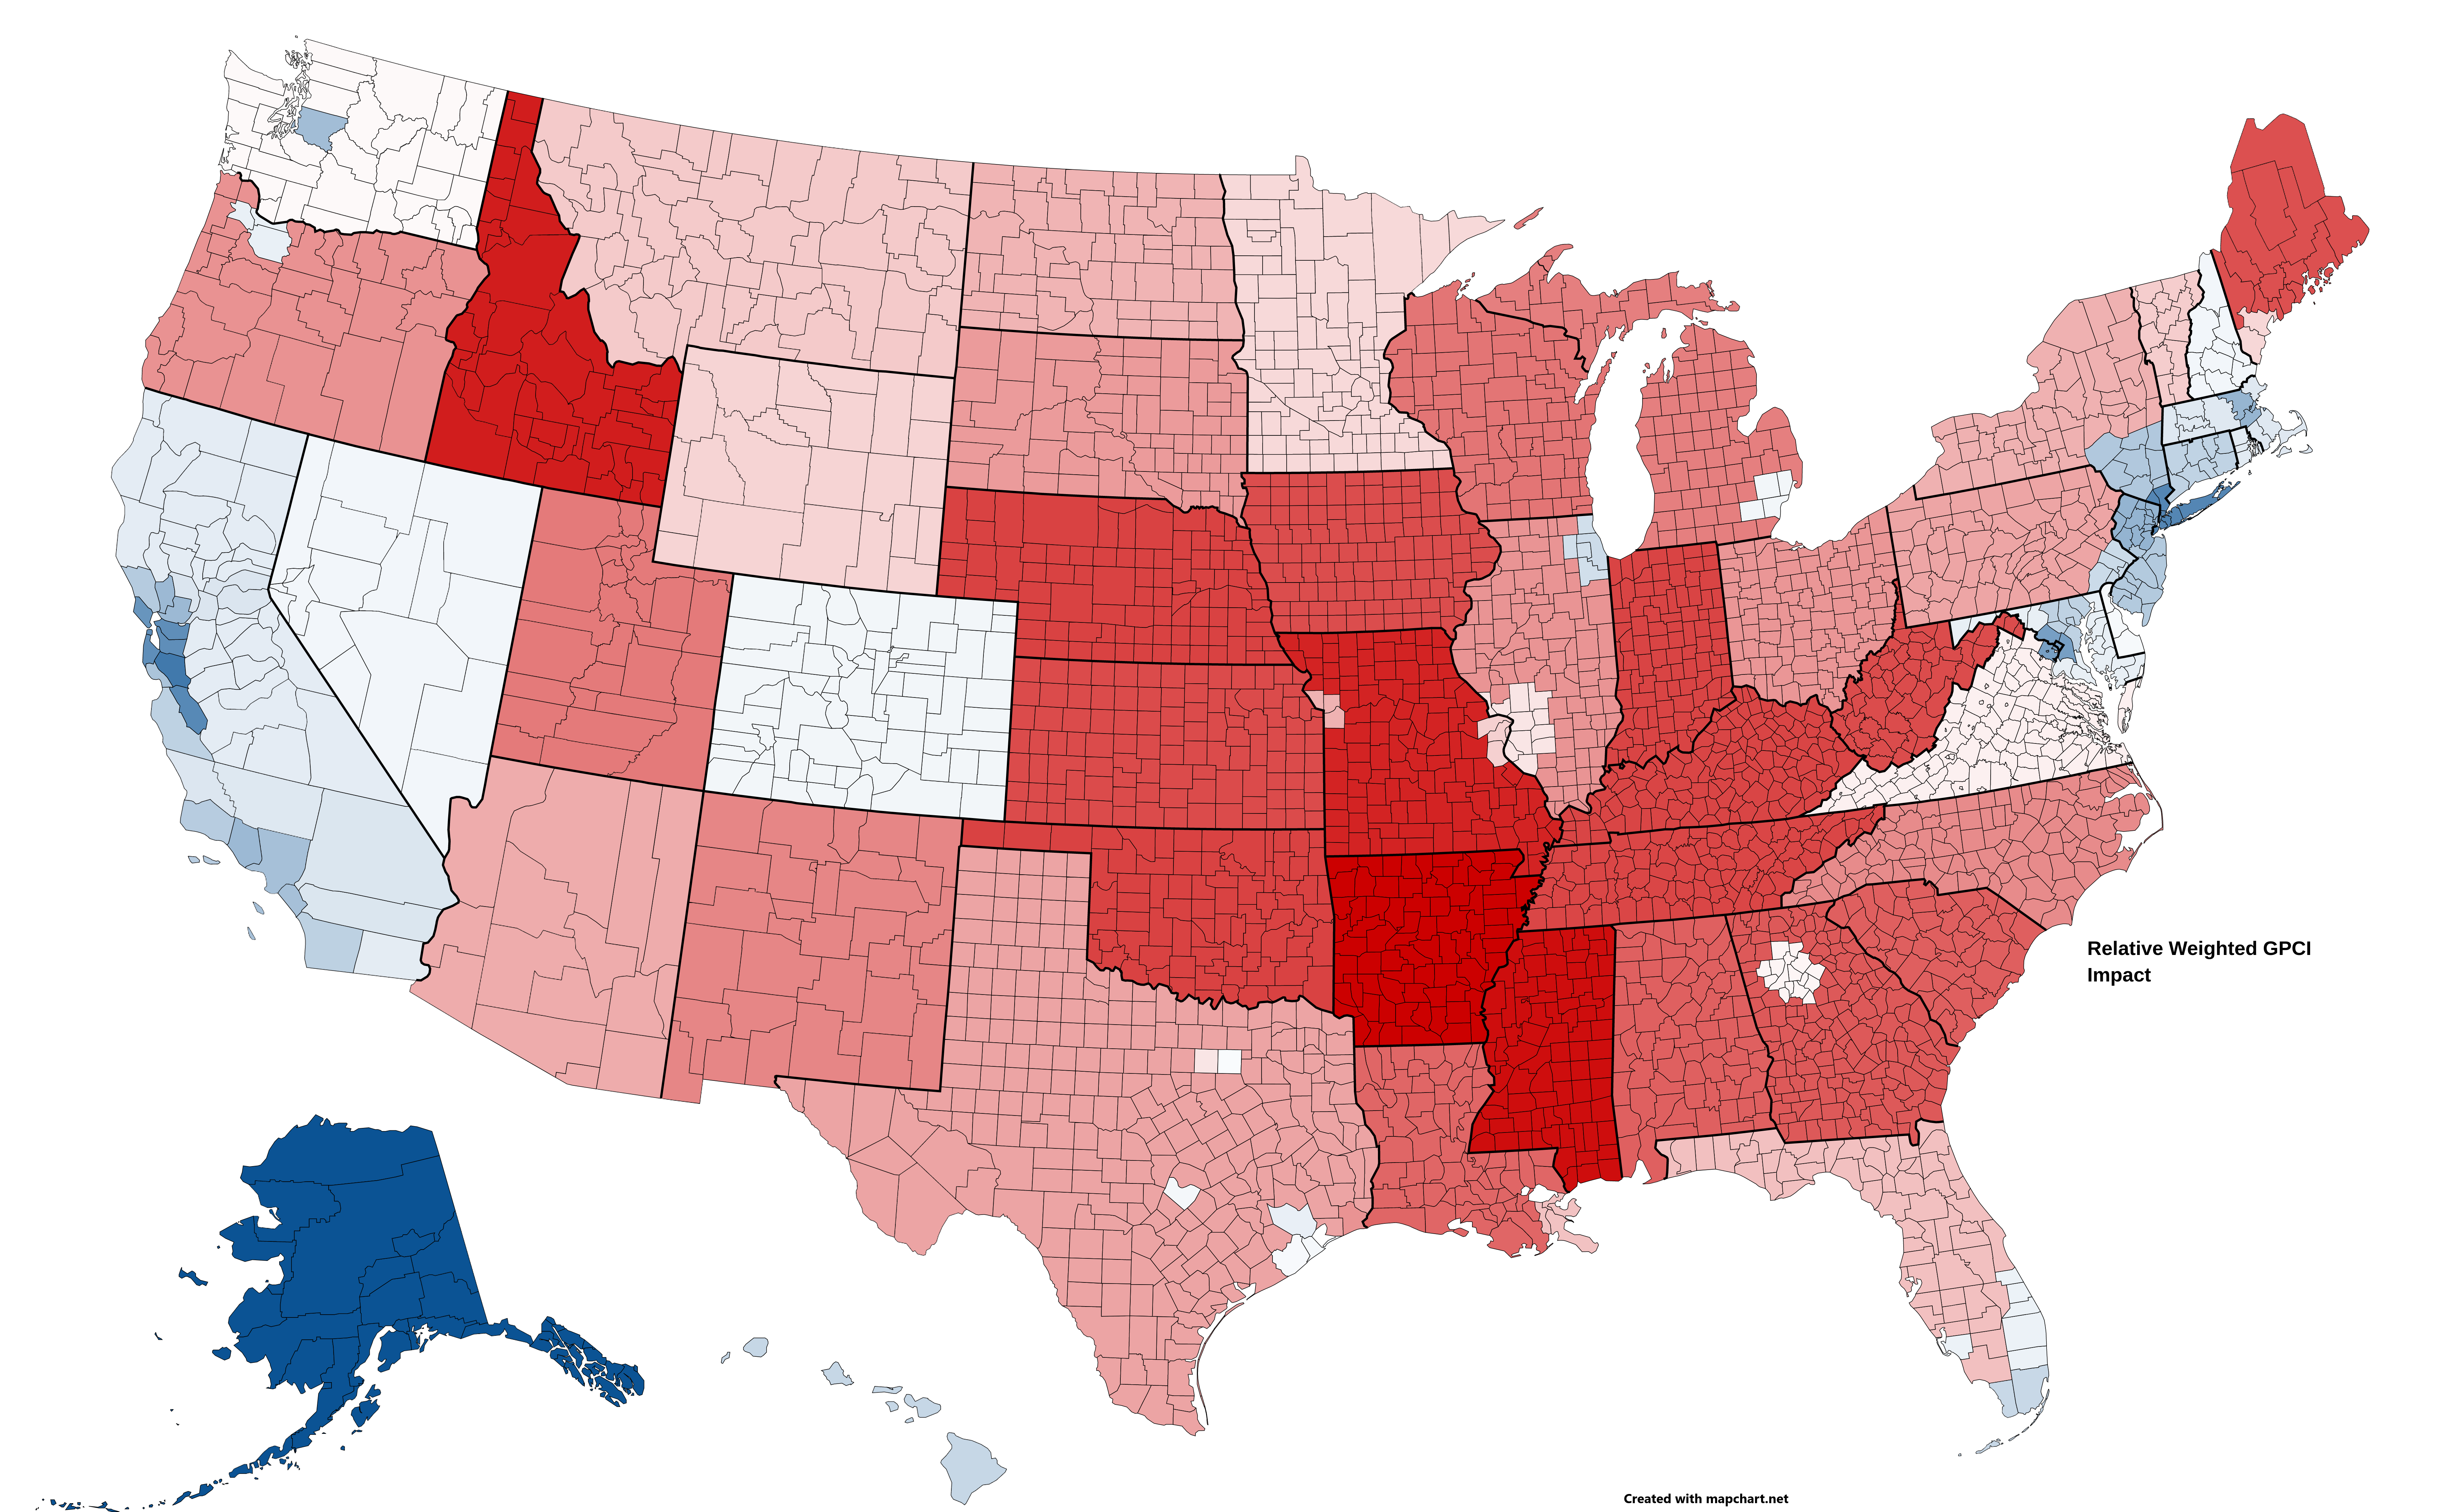
Now, here's a similar map, but with the overall relative GPCI weighting as of 2021. If I get motivated, I'll do the same thing for 2010 or something and see where the money has moved to. Another way to think of this map is it shows you where CPT codes are paid at the highest rates.
These cool maps were made using mapchart.net, a really cool site that helped me automate this process. I hope to do more cool things like this in the future!
If you don't think that the GPCI values are important, consider this: because the overhead in a pediatric practice doesn't change with these new values, but the revenue will, the effects here are multiplied on your personal income.
Let's walk through this. We'll use a typical pediatric practice with a 65% overhead, practicing in New Orleans (-1.71% from 2017 to 2021). Your overhead still gets paid first, so that -1.71% comes right out of your owner income. If you have a typical overhead of 65%, say, then that 1.71% makes up about 5% of what's left for you! A reduction of 1.71% off the top $600,000 of revenue is potentially worth more than $10,000 to your personal income. Good luck with that. If this math doesn't make sense, speak up and we'll do the math out loud.
Comments
6 Comments