Before I talk about vision screening, here's my gentle reminder that it's time to sign up for the 2019 Pediatric Supergroup Meeting! The speaker lineup is awesome, the opportunity to engage with the best and brightest is intense, and the early bird discount ends in a week. The meeting is for any independent pediatric practice.
Back to the subject of vision screening.Over on Facebook, some wiseguy asked PCC what we're seeing for vision screening usage given my report almost 10y ago that we weren't seeing much of the (then) new 99174 code. Boy, have things changed and it's a good time to dig into this.
Measuring screening volume is a tricky business. You have the theoretical goal of accomplishing vision screening 100% of the time, but you also have the more realistic goal of screening 100% of the time when the patients come in. Although we shouldn't discount all of those kids who don't come in for their well visits, the most accurate review of your clinical effort may be what happens during a visit you do perform.
In the world of vision screening, it's particularly tricky because although Bright Futures outlines 8 well visits (out of 30 through age 21) during which a pediatrician should perform vision testing, Bright Futures and common sense also indicate that more vision screening is required for at-risk kids, such as any kid who had an abnormal vision screen previously. In other words, we should probably expect to see that the ratio of Well Visits:Vision Screens in a pediatric office isn't simply 8:30, or about 1/4 pf the time, but perhaps a lot higher.
That ratio may also be offset by the fact that most preventive vision screening happens as kids get older, which is when well visits tend to drop off.
So until I dig into an analysis of vision screening on a visit-by-visit basis, we'll have to settle on an overall comparison of vision screenings to well visits. I grabbed PCC data for 2016 through 2018 (it's a few million data points) and here's a picture of the results:
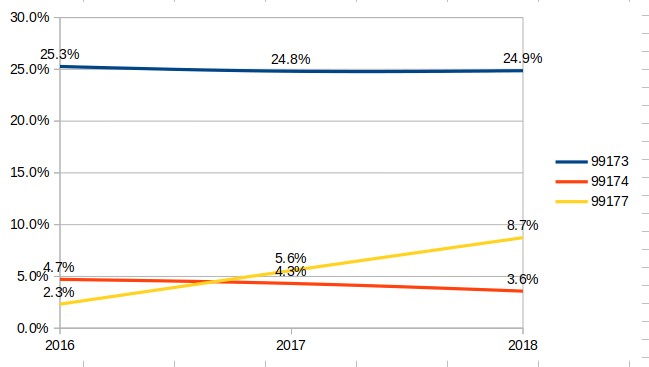
How does this chart read? In 2016, the ratio of 99173 to well visits was 25.3:100 (99173 : (9938X+9939X)), or almost exactly the expected 1/4 ratio. But they also have a 4.7:100 99174 ratio and a 2.3:100 99177 ratio. Lo and behold, with vendors like GoCheckKids making waves, 99177s have increased in volume (relative to well visits) 3-4x while 99174s has dropped slightly. Overall, our clients have a 37.2:100 ratio of vision screens:well visits - just what we expected. Interestingly, most of that growth is attributable to the big increase in the 99177, which I attribute specifically to the aforementioned vision screening tool.
Thoughts?
Comments
2 Comments