Executive summary: the evidence that child BMI is increasing significantly during COVID...maybe? A little? However, we need to check again in a couple months.
Back in July, I looked at myself in the mirror and wondered aloud, "I wonder if kids are in worse shape because of COVID?" PCC has been doing a lot of BMI-related study work this year (with the help of some hard working clients) and that topic is often on our minds. The concept makes some sense...kids aren't able to run around outside like they could last year, they're cooped up watching videos all day, etc.
I poked around a little bit but the data didn't provide a narrative. We were only ~3 months into the pandemic and it was obvious that if there were a heavy change in pediatric BMI, we'd know without the data.
We're 9 months into the pandemic now and any change should be in the numbers at this point. And as far as I can tell so far...maybe it is, just a little? Maybe not. But it's not the story that I'm hearing on SOAPM and from some of my clients.
With help from the nerds, I grabbed BMIs recorded for every patient visit going back to 2015 and grouped them by age and sex. It's a LOT of data, and when that happens, it can be difficult to create a succinct and accurate portrayal of the story, but I'll do my best.
From my perspective, if childhood BMIs are increasing to the extent that pediatricians are talking about it on-line, it should be fairly visually obvious. Here's my first take:
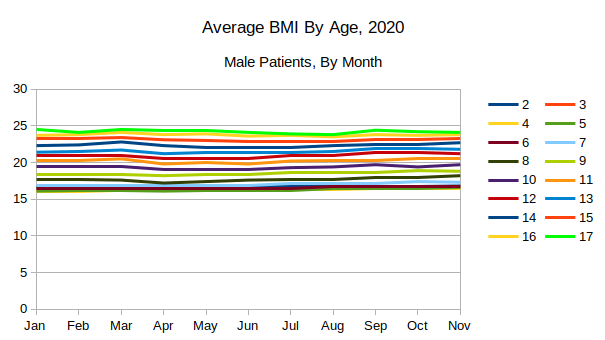
The X axis represents the months of 2020 through November. The Y axis is the average BMI. Each colored line represents the age of a patient at the time of their BMI measures. You see at the top, for example, that the 17yos begin 2020 with the highest BMI (24.5) and end with the highest (24.1). [Note the drop.]
Sure, a couple of the average BMIs go up slightly. The biggest gain is among the 8yo, who go from 17.7 in February to 18.2 in November. I welcome a clinician telling me below that moving from 17.7 to 18.2 is a big deal. Obviously, a continued creep up the ladder is no good. But if I go back to December 2018, the difference is about 30% smaller. In fact, the average BMI for 17yos is lower in November 2020 than it was the first 6 months of the year. And it's lower than it was in 2018 and 2016 (based on core samples).
In other words, there's a fair amount of mild fluctuation in BMIs over time and I'm not sure I can distinguish the effect of COVID on late 2020 BMIs vs. the natural change over time. And depending on when you look, some ages are in fact lower in 2020 than they were previously.
Let's look at the girls now.
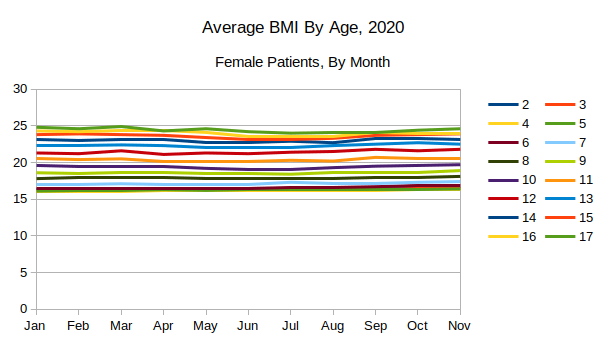
Same mixed bag. No real uptick.
But pediatricians are reporting a real impact. Could I be missing something? I realized it's possible that using an average BMI score might hide a group of patients who have increased BMIs if there are other children whose BMIs have dropped. To see if this is happening, I grabbed 3 ages (6, 9, and 14 females) and looked at their distributions in February and November. This will show us if kids are moving to the extreme ends of the BMI distribution - which could leave the "average" intact. I suppose I could also look at some kind of deviation change, but I wanted a visual I can understand.
Below, I show you two of those ages, the 6 and 14yo (I dropped the 3rd because the graph was too messy, but it tells the same story).
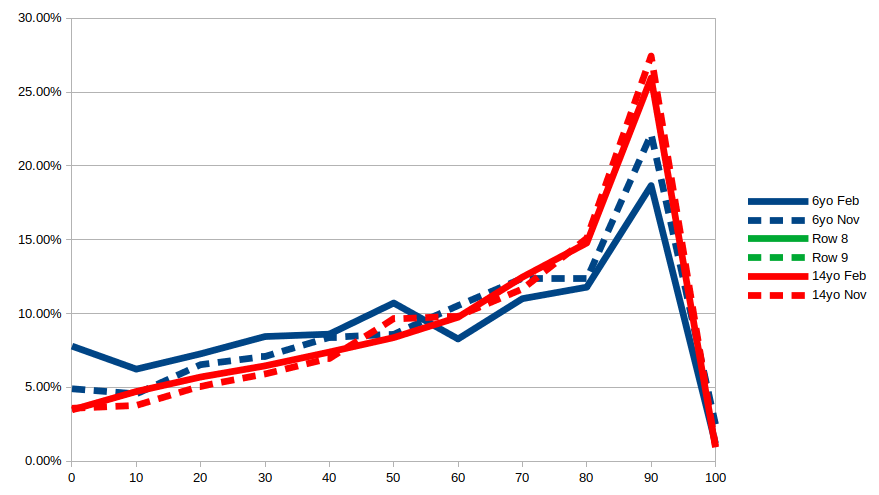
The X axis is the BMI percentile and the Y axis is the percentage of of kids in each one of those decile buckets (we can discuss later why this curve isn't flat).
Each color represents an age. The solid line represents the February BMI distribution, the dotted line is the November distribution. Where the dotted line is "above" the solid line, you can see that kids have shifted into that decile from above or below. Using the dotted blue line, you can see that 6yos did have an interesting shift into the 60-90th percentile groups. Both those shifts are tiny. I've blown up the image here so you can see the differences, but there doesn't appear to a big shift to the edges.
I've thought of a few other ways that this data could tell a different story from what's really happening in practice, but it seems unlikely that we're missing something big.
ONE SIDE NOTE: Our December BMI data was obviously incomplete at this point, but there's stronger evidence of an uptick in our limited sample. I want to check this in a few weeks and see if the BMIs are taking off. I might have to retract this entire blog, soon!
Comments
6 Comments