A few weeks ago, I was exchanging emails with Dr. Suzanne Berman in TN about...geeze, I don't even know any more. Something mildly technical and nerdy relating to pediatric practice management.
While we were both on the phone looking at pediatric data, we found ourselves asking a question: what portion of the payments to pediatric offices come directly from patients? In other words, how much more or less of the bill are your patients paying these days?
Our presumption was that the patient obligation has grown the last couple of years. After all, with the rise of HDHPs (and big ol' copays), the industry is clearly shifting the financial burden more to the patients. And I've written about the constant assumption that those high deductibles are keeping kids out of the office. Surely, we'd be able to measure that, even mildly, right?
Guess what we found?
Dr. Berman noticed first. The personal portion of her revenue decreased over the last 10 years. I looked at the data for a few clients and noticed the same thing - the trend is very real. And steep.
I asked Igor for the full meal deal, data-wise, and he pulled payments dating back to 2003 for me. We're talking an analysis of almost $5billion of transactions. I found that patient payments make up a much smaller portion of the overall revenue for pediatricians than they used to. It's dropped by nearly half. 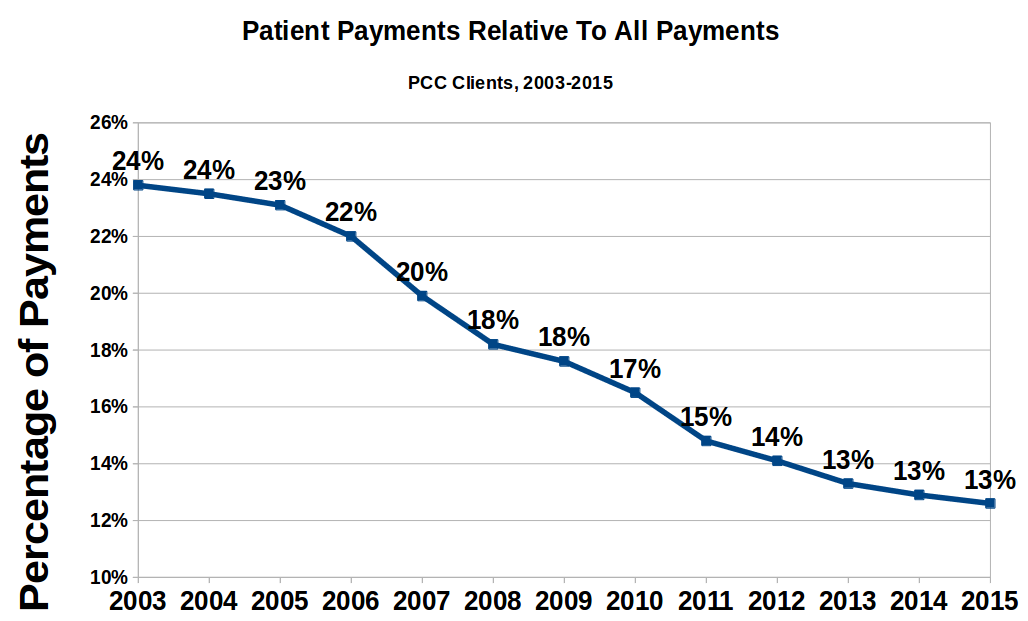
I shared these results on SOAPM looking for answers and responses. I also wrote to Sue Kressly, as I knew that her husband (Greg Anderson, also of OP), would be both interested and capable of looking into the data as well. Both SOAPM and Greg stepped up.
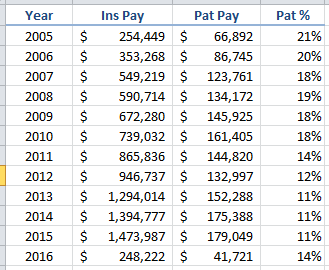
His first run through the data from his wife's practice supported my analysis:
But then, in his own words:
"Wait a minute, vaccines comprise a big piece of pediatric revenue, and payers (almost) always cover them, and their prices always go up, and this doesn't take into account COGS (cost of vaccine inventory), so let's just look at E&M services:"
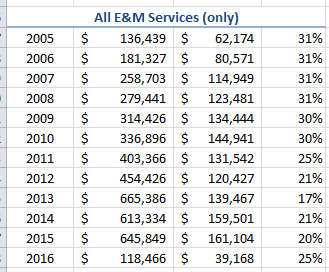
"Which as you can see were remarkably consistent until 2011. And what happened in 2011? Think about it ... wait for it ... patients began to experience nearly universal $0 well care for the first time! Well, what if we only look at non-preventive E&M services?"
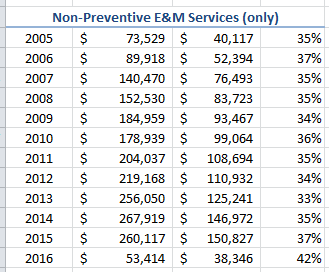
"Now it is VERY consistent, and if anything has an upward trend. Finally I asked, what about non-preventive PROCEDURAL services and LABS? In other words, any CPT other than the 9XXXX series?"
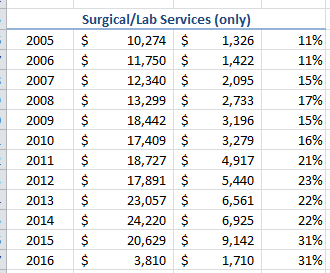
"This begins to tell the REAL story. Double and even triple non-E&M services are beginning to pile up patient responsibility. I would posit that is why it is "feeling" so bad to practices even though their net percentage of total collections from patients has slightly declined."
At this point, I had some questions for Greg. "The volume represented by these codes is tiny relative to the rest, right?" You can see that, at the peak, the personal payments for these codes is only 5% of the total patient payments. Puny. I couldn't imagine that an increase of about 1.5% in patient payments in one category of charges - when overall patient contribution is dropping considerably - could leave such a bad impression with the patients.
Greg had a good thought about that:
"So here is the crux of the argument to me. Are we talking about "financial risk" or "billing hassle?" It's a small percentage of the money, but not the claims involved. It used to be that when Sue did a sick visit with a quick strep test, we could pretty reliably count on the test itself being covered. Now more often than not, it results in a $12-18 deductible to the patient - even when the visit itself is covered by the copay. So now we need to either send a bill for $12 (which we don't - $25 is our minimum statement amount - and will almost always result in a difficult exchange with the patient wondering why they suddenly owe money for this kind of test) or hold on account until they come in again and hope the front desk is paying attention and collects the due balance at that time. (Which exchange will also get longer, because it happened 4 months ago and they "forgot" they owe the money and will need to have it reexplained.)"
So, is that it? That even though patients appear to be paying less, they think/feel they are paying more because they are being billed later?
Greg dug more. And this is what he learned: the money collected from patients AFTER the visit has effectively doubled at his wife's practice (in terms of claims requiring patient A/R followup as well as the unique number of patients who need to be tracked down later). This definitely could explain why the patients feel they are paying more when, in fact, they are paying less.
Greg added this:
"Our Director of RCM is of the opinion that from a billing perspective, you should look at the ratio of A/R (NOT ultimate collected amounts) attributable to payers vs patients as the best way to measure the increased hassle factor. It is WAAAAAY up in our RCM practices."
Fascinating points, and I'd be inclined to agree with him. However, looking across all PCC clients, I don't see a huge increase in personal A/R. It's remained relatively steady. I also wonder how much the economy has played into this: people may feel a greater pinch because they have less to pay with?
Someone on SOAPM - forgive me, I lost track of who it is! - also pointed out that Medicaid has expanded in the last few years and perhaps that expansion has fed the reduction in personal payments. Igor grabbed the payment data, excluding Medicaid:
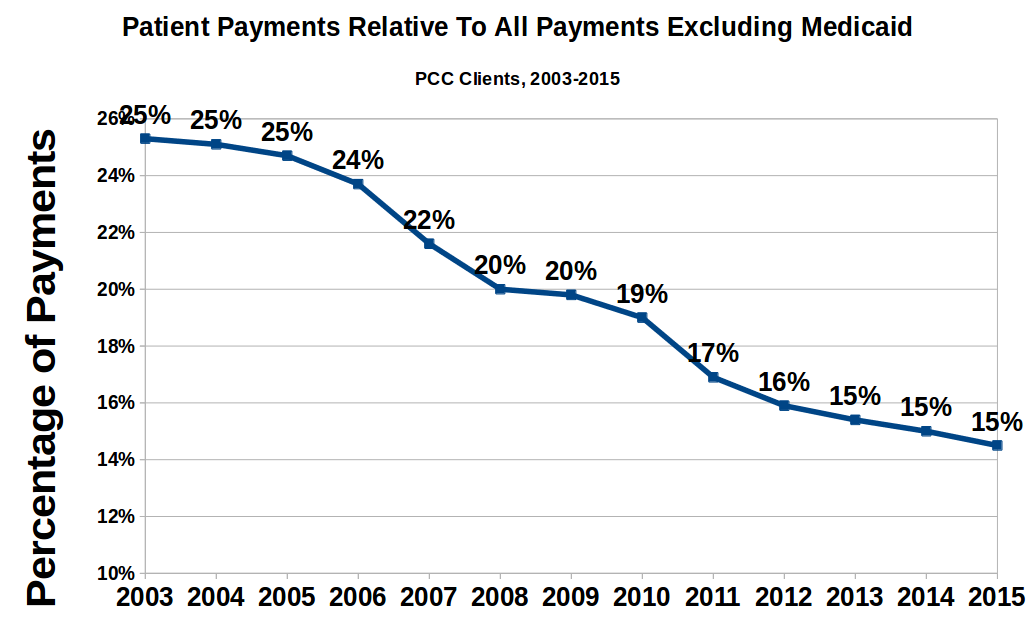
Nope, that's not it either. Medicaid payments are so low that they don't move the non-personal payment needle enough to have an effect on the overall patient contribution ratio.
Robin Warner wondered if part of the issue is that patients are also paying a larger portion of their premiums. Given that their OOP expenses are up already, patients may attribute all of that spend to the doctors they see routinely (i.e., pediatricians) even if you are seeing none of it. In other words, patients feel like their costs are more expensive - which, to them, they are - even if you are seeing less of their money.
Ultimately, I expect that we need either more data or to segregate the data more carefully - by region, Medicaid %age, etc., in order to explain why Dr. Berman and I see different data from Greg and OP's RCM business. This may be a regional thing, I suspect. I have no idea what the geographic distribution is of OP's RCM business, but if it's concentrated anywhere, that might explain it. I am convinced, though, that this is evidence of how broken our system is. Patients are paying the physicians less, yet feel that the doctors are more expensive...that's definitely a broken capitalistic model. [Update: Greg says that their RCM clients are distributed around the country; the only pattern is that they might be relatively smaller practices.]
In the middle of this conversation, Greg had this important aside:
"Another thing to keep in mind is that this chart neatly belies the notion that your patients can't afford to keep coming to you if you don't participate in their insurance. Since vaccines are nearly always covered regardless of who delivers them, the truth is that the patient is already covering (on average) in excess of 30% of the cost of non-preventive services anyway! So the net hit to their wallet is not really that significant. The only hit is well care - which would have been 100% covered in most cases - but except for children in the first 3 years of life, that is no worse than an annual charge anyway."
So, what has happened to your payments?
Excellent, excellent point!
Comments
0 Comments