I love pediatric benchmarks. Knowing the real underlying behavior in my clients' offices helps me speak to them and understand them better. There's a particular joy and insight to finding data that challenges the status quo understanding that physicians have of their own offices.
Here's one, and this is very, very interesting data. Ask a pediatrician - ask yourself - how many of the kids you treat are up-to-date with their physicals. When I ask, I usually hear things like, "Well, just about all of them!" Or, "90% or higher!" Practices feel like they do a good job getting all those visits in when we know that's really not true.
Not only are getting those physicals done good medicine, they're good for your bottom line. Most practice I work with have missed thousands of well visits this year. Yes, thousands. At ~$100-200 a pop, you can do the math.
Don't believe me? Don't think you're one of those offices?
Igor and I already broke down active physical rates for our internal benchmarking dashboard our clients enjoy, but we wanted to do something for everyone. So, here it is.
What "we" did (I say "we" because Igor did most of the work, I just do the heavy thinking, you know...) - we broke kids down into 5 different age groups and then took a look at how many of them were up-to-date with their physicals. For all the kids over the age of three, it's easy to calculate: all of the active kids who have had a physical in the last year divided by the total active kids in your practice.
For example, if you count up all the active kids between the ages of 3 and 6 years old who had had a physical in the last 365d, you might find 1500. If you then count up all the active kids between 3 and 6 years old, regardless of their physical statuses, you might find that there are 2000. 1500/2000 = 75%. Get it? Non PCCers can do this easily, in theory. For kids in the 15m to 3yr category, we looked for a well visit within the last 6 months. Younger than that, it gets tricky.
Let's take a look at the first part of the results (click on the image for a zoomed in view):
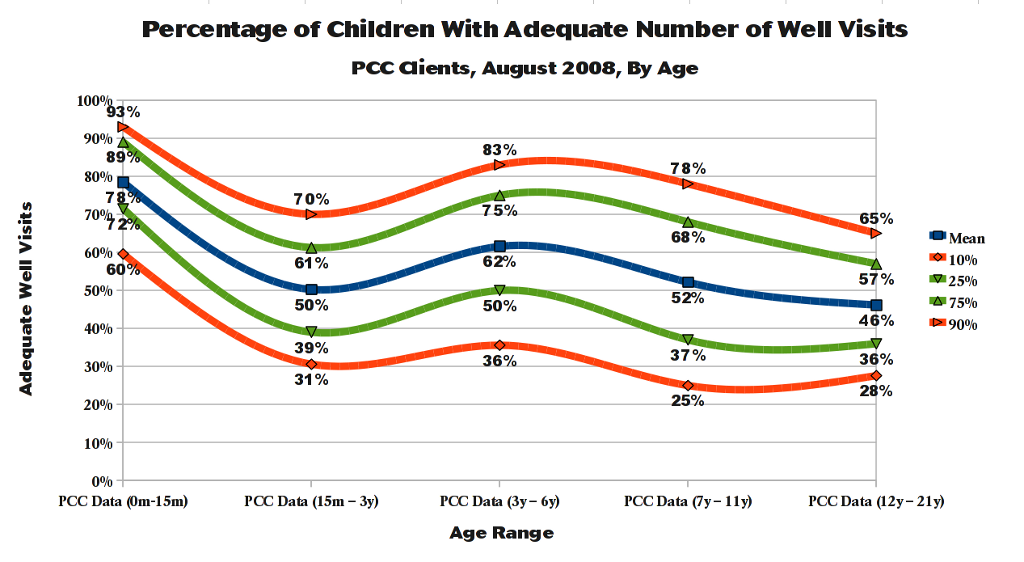
I hope this is easy enough to follow - the blue band represents the mean percentage of active patients in each age group who are up-to-date with their physicals. The surrounding green bands represent the 25/75th percentiles and the red bands represent the 10/90th percentiles.
So, which percentile are you in?
Are 1/2 of your kids from 7-11 overdue for their physicals? What scares me the most is the big dropoff for the kids in the 15m-3y range. More next week.
Comments
0 Comments