A little over a week ago I gave my standard "Pediatric Benchmarks" talk (newly updated with some fascinating clinical benchmarks!) and I found myself summarizing the two or three most important measures I use when consulting for practices. I suppose it's ranking your favorite vital signs - they are all useful, and they all require context, but if you HAD to pick just one or two, what would they be?
For me, the single most important number I look at is the Revenue-Per-Visit. It's simply the calculation of how much revenue you generated divided by the total visits you performed over a specific time frame. It's not perfect, and it doesn't stand alone (any more than, say, temperature or weight would), but knowing someone's $Rev/Vis helps put a lot of things into context. Some things that go through my mind when I look at this information:
- A low $Rev/Vis often yells "Opportunity!" for me. When I meet a practice generating $100/visit, I know that I might be able to do more for them than a practice at $180. The $100 practice needs to be willing to make changes, though.
- Distinguishing the $Rev/Vis with and without immunizations is often important.
- We know that the $Rev/Vis is a lot higher for well visits than sick visits (2-4x) as a rule. When I sample, I like to do a year so I cover the seasonal rates. Measuring your $Rev/Vis in the middle of July when you are piling on the well visits will skew your results.
- $Rev/Vis always needs context from other measures (Sick:Well, Medicaid volume, well visit coverage).
I thought it might be helpful to see some of this data in real time. Here's PCC client data as of this week:
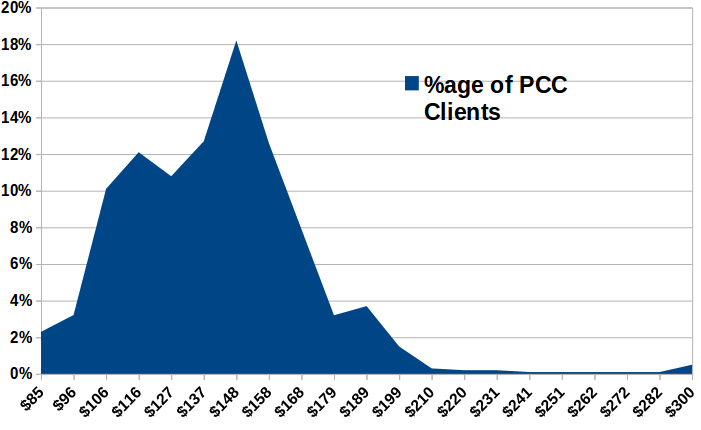
There it is. Fascinating distribution. Not normal, particularly with that long tail. A couple interesting hops. When we remove immunization product revenue, it gets more interesting. Master's class question: what do you think happens when I subtract immunization product from the equation? How does the graph change?
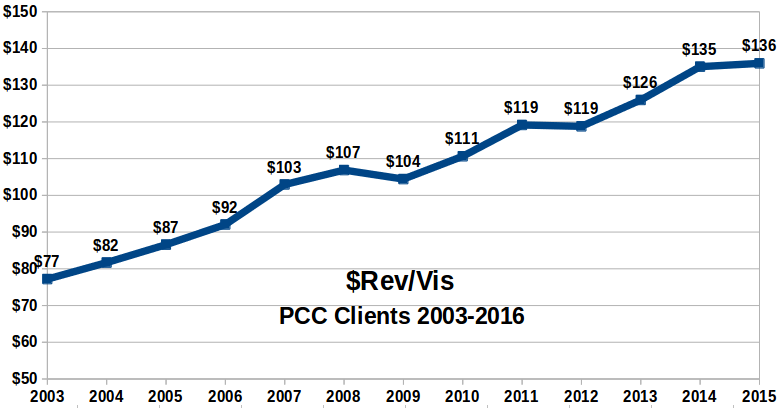
You should also ask, "How has this measure changed over time?" Here's some data going back to 2003 for our clients. When I present this data, I typically ask, "What happened in 2009 (and in 2012, to a lesser extent)? Can you figure out how the $Rev/Vis went down, yet pediatricians generated more revenue during those years?" I also like to talk about why I think there has been such a clear increase in revenue for pediatricians (it's not all bad news).
I hope someone finds this helpful.
Comments
1 Comment