Pardon my brief absence. I start a piece every day and then get distracted by some shiny object and don't return. OK, maybe I'm being distracted by some really fun sites.
I promised to share some of the details of our data comparing work and revenue volume over the last couple years. Not everyone believes that our customers have continued to show an increase, no matter how mild, in their business through the fall and the end of the year. I have two or three blog's-worth of data, so let's start!
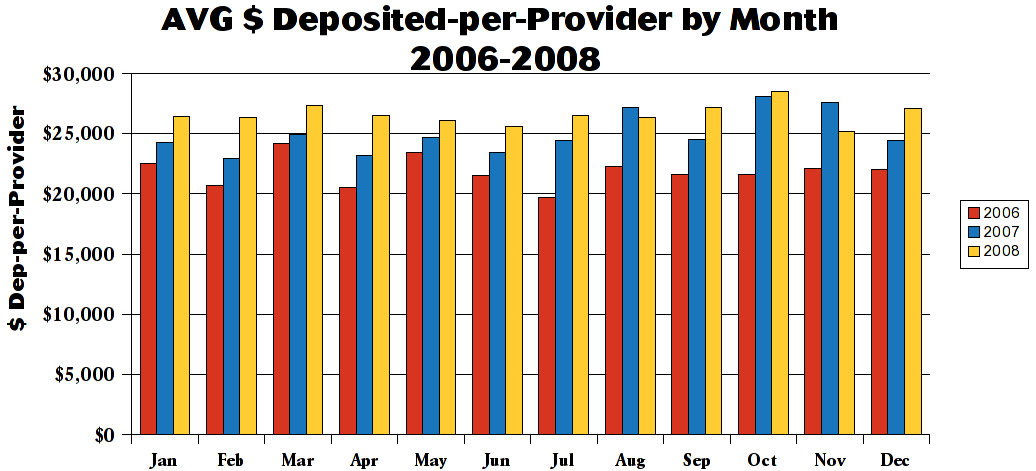
OK, what we have in graph 1 (click on it for a closer look) is a review of our average deposits, per-provider, from 2006-2008 for PCC clients. Don't use the absolute figures as a solid benchmark, because our method for counting providers may be different from yours, but you'll see the same result: the deposits, on a per-provider basis, have continued to climb for PCC clients from month to month.
You'll note two exceptions: August and November. November is easy to explain: we had fewer 'working' days in Nov 2008 vs. Nov 2007. I don't know what happened in August - haven't felt compelled to check - but the recession wasn't being spoken of in meaningful terms then.
How do we adjust for the difference in working days, etc.? You tell Igor to run the numbers as a "deposits per working day" and he does it quickly.
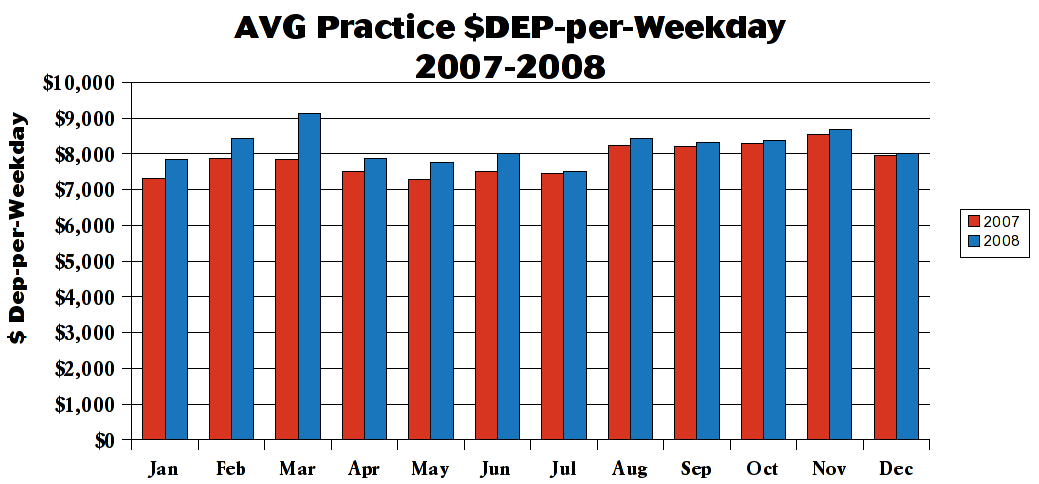
Well, there you have it - the increase is slight, but our clients really are bringing in more money every day of 2008 vs. 2007. And I can see that August 08 had fewer weekdays than 2007.
I suspect that a lot of practices started to see the typical December slowdown and attributed it to the recession (it's a 5-6% drop every year).
Tomorrow, a regional view of events.
Comments
0 Comments