As promised, before I go to Africa, please find some pediatric data gold.
Below is a graph of the visit rate changes our clients reported comparing December 2007 to December 2008 (I'll do 1Q when I get back) broken down by region and by weekdays in the month. The latter adjustment is important, because any given month can swing standard working days by nearly 10% (or more, in the case of holidays) from year to year, which confuses people.
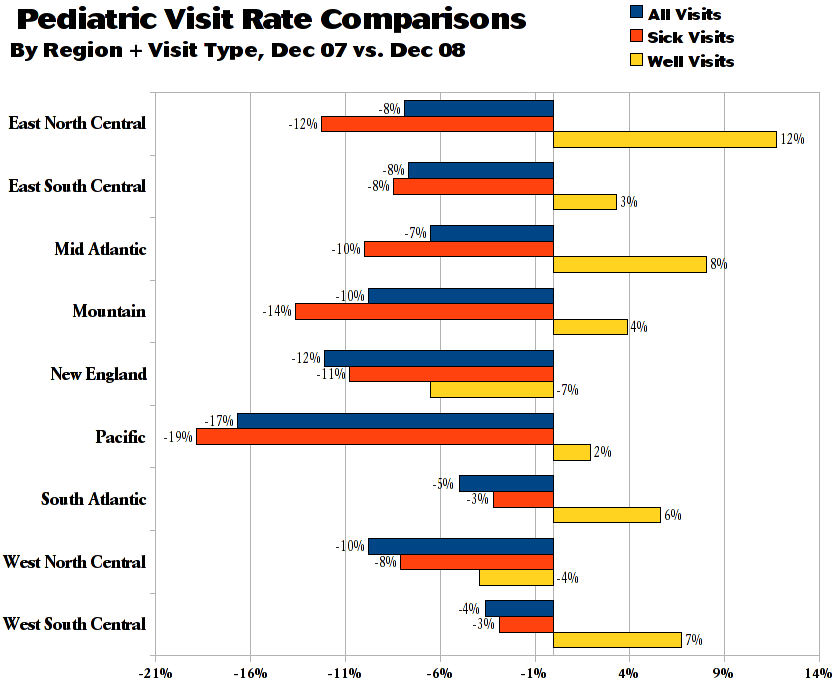
[Click here or on the image for a close-up.]
What do we learn? Well, if we keep in mind that lower visit rates do not always result in lower revenue, it would appear that a lot of PCC clients are swapping out well visits for sick visits. This is a good thing, imo, but I cannot say whether its the result of a late flu season/light sick season or aggressive preventive care management.
A quick glance at this amazing chart from the NYTimes will give you some possible explanation for the geographic disparity. But, as it may surprise some, New Jersey isn't suffering worse than the rest of the country...
Comments
0 Comments