Last week, I posted some data about national visit volume that I hope made clear that the perceived dip in the January 2014 visit volume was largely cyclical and weather related. Sure, there are some practices whose variance isn't explained so easily. For example, one of the comments I received reflected my thoughts:
"I think there data would be more clear if your grouped your clients by zip code or region. The weather has a direct influence and sick season probably starts at different times in the east versus west coast."
Let's see! Below, I've broken the visit data down by US Census categories and pulled out one obvious set of states to see if there are geographical highlights. Some caveats:
- PCC data by region is not as effective as the national data. In some regions, like the Pacific, there are far fewer examples than, say, the Mid Atlantic region.
- It may be that the census groupings don't make sense from a weather or clinical relationship perspective.
- Although the weather patterns are uneven nationally, it may be that a month-sized sample evens things out.
- I'm comparing the month of January in each instance, not the estimated "peak" time frame from each season. Last week, we noted that perhaps we ought to look at Oct-Dec 2013 to compare to Jan 2013 instead.
Oh, which states are in which group?
- New England Division: Connecticut, Maine, Massachusetts, New Hampshire, Rhode Island and Vermont
- Middle Atlantic Division: New Jersey, New York and Pennsylvania
- East North Central Division: Illinois, Indiana, Michigan, Ohio and Wisconsin
- West North Central Division: Iowa, Kansas, Minnesota, Missouri, Nebraska, North Dakota and South Dakota
- South Atlantic Division: Delaware, District of Columbia, Florida, Georgia, Maryland, North Carolina, South Carolina, Virginia and West Virginia
- East South Central Division: Alabama, Kentucky, Mississippi and Tennessee
- West South Central Division: Arkansas, Louisiana, Oklahoma and Texas
- Mountain Division: Arizona, Colorado, Idaho, Montana, Nevada, New Mexico, Utah and Wyoming
- Pacific Division: Alaska, California, Hawaii, Oregon and Washington
I'm sure I can (and should) drum up more warnings before showing the data, but here it is anyway. Click on the picture for a zoom-in.
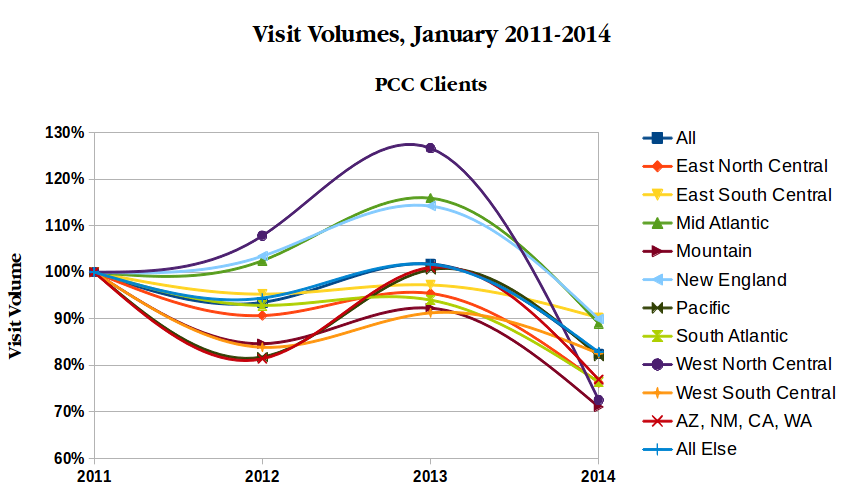
Conclusions, no matter how weak, we can draw from this data:
- Most, but not all, regions saw a dip in 2012 and then a huge jump in 2013, making the dip that all groups saw in 2014 that much more dramatic. This is particularly true for our clients in the "West North Central" bracket.
- Subjectively, I grouped AZ, NM, CA, and WA together as places where I guess the weather had the least impact this year (I consulted a monthly weather log from NOAA). You'll see that their 2011 -> 2012 and 2013 -> 2014 changes are fairly dramatic.
- The "Mid-Atlantic" (NY, NJ, PA) and New England (CT, RI, MA, ME, NH, VT) - where PCC has the most clients - got nailed this year. We know that December 2013 looked a lot better for them, but there it is.
- East South Central (AL, KY, TN, MS) is the most stable and flat of the group. Maybe they don't have the same infectious season as, say, New England.
- My subjective grouping of some "warm" states shows that they were hit just as badly as everyone else ("All Else"), perhaps more so. I suspect that there are variables there that are outside the scope of what we're looking at here.
Next, I will try to tease out sick/well visit rates, perhaps!
Input welcomed.
Comments
9 Comments